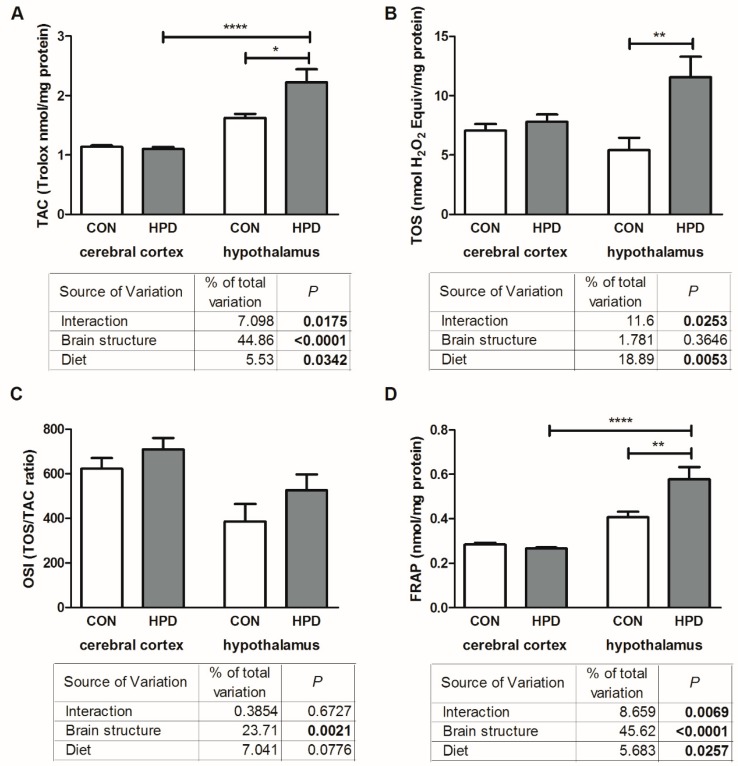
Figure 4.
Effect of 8-week HPD on total antioxidant capacity (A), total oxidative status (B), oxidative stress index (C), and ferric reducing ability of sample (D), in rat cerebral cortex and hypothalamus. Values are means ± SEMs, n = 9. Differences statistically significant at: * p < 0.05, ** p < 0.005, **** p < 0.0001. CON, standard diet; FRAP, ferric reducing ability of sample; HPD, high protein diet; OSI, oxidative stress index; TAC, total antioxidant capacity; TOS, total oxidative status.

