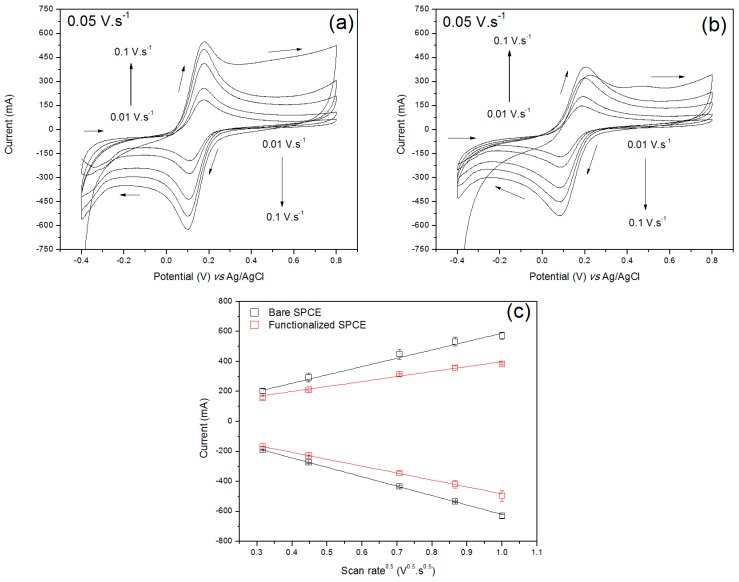
Figure 4.
Cyclic voltammograms related to the bare (a) and functionalized (b) SPCE under different scan rates (0.1, 0.075, 0.05, 0.02 and 0.01 mV·s−1) in 0.1 M KCl + 5 mM Fe(CN)63-/4- and the relationship between the anodic/cathodic current peaks of the redox species at the electrodes and the square root of corresponding scan rates (c).

