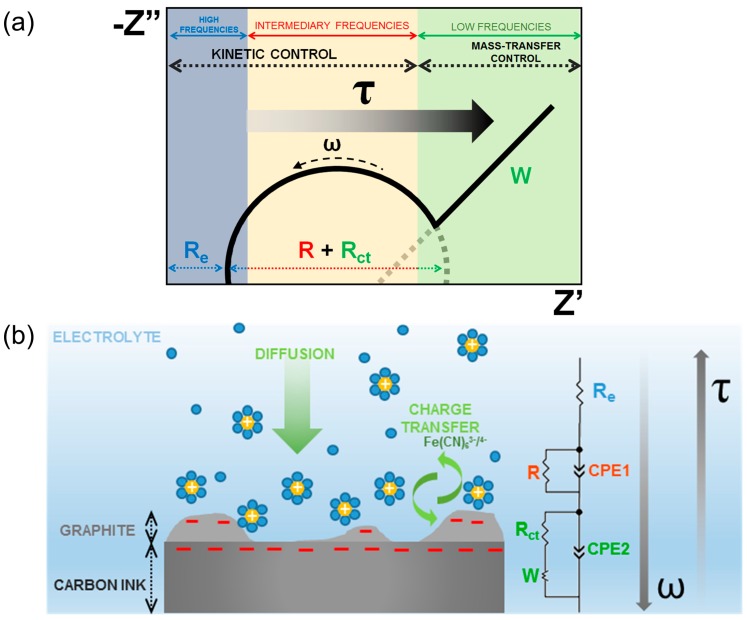
Figure 11.
Scheme of the relationship among the time response and the impedance parameters as a function of the frequency in the Nyquist plot (a) as a consequence of the interfacial phenomena occurring between the SPCE and the electrolyte (b). In the illustration, the yellow spheres with the signal “+” correspond to the cations solvated by the molecules from the bulk solution (blue spheres) and the signal “−” on the different regions of the SPCE corresponds to the electrons electrostatically attracted toward the interfaces.

