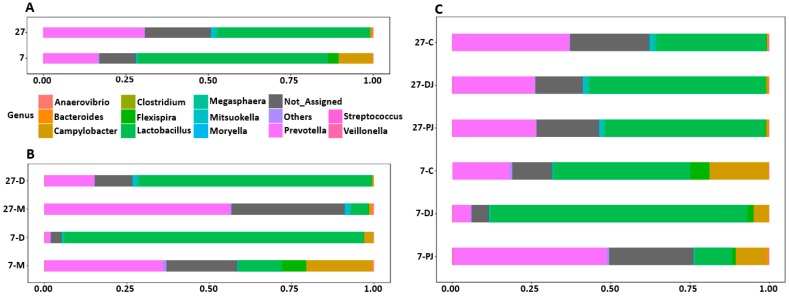
Figure 2.
Relative abundance of different genera at post-weaning ages (A), different locations (B), and different regions of GIT (C). The 7 and 27 represent 7 and 27 days, respectively, after weaning; M and D represent mucosa and digesta samples, respectively; PJ, DJ, and C represent proximate jejunum, distal jejunum, and mid-colon, respectively. Not_Assigned represents the sequence reads that were not assigned at the genus level but assigned at the higher taxonomic level, whereas Others represents the bacterial phyla whose counts were lower than 500.

