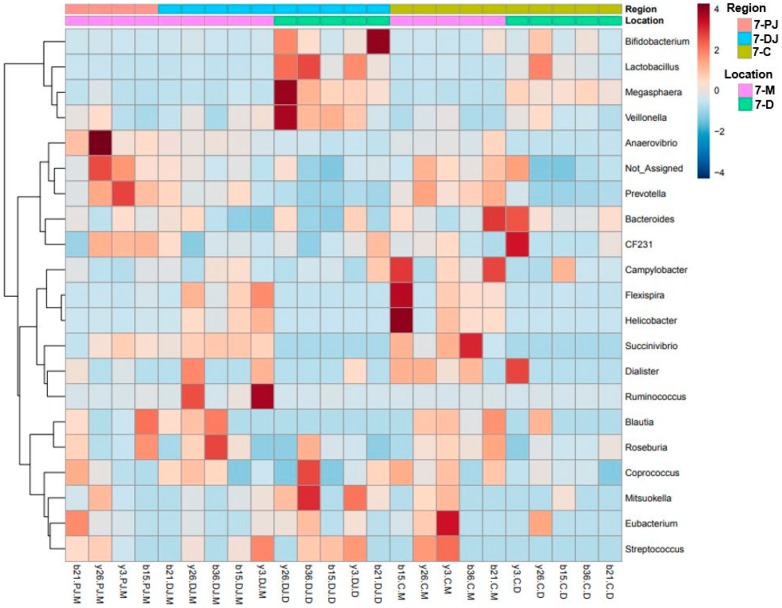
Figure 3.
Hierarchical clustering heat map of bacterial genera from 7-day post-weaned pigs generated by MicrobiomeAnalyst using Euclidean distance measure and Ward clustering algorithm. The 7 represents 7 days post weaning; M and D represent mucosa and digesta samples, respectively; PJ, DJ, and C represent proximate jejunum, distal jejunum, and mid-colon, respectively. Not_Assigned represents the sequence reads that were not assigned at the genus level but assigned at the higher taxonomic level.

