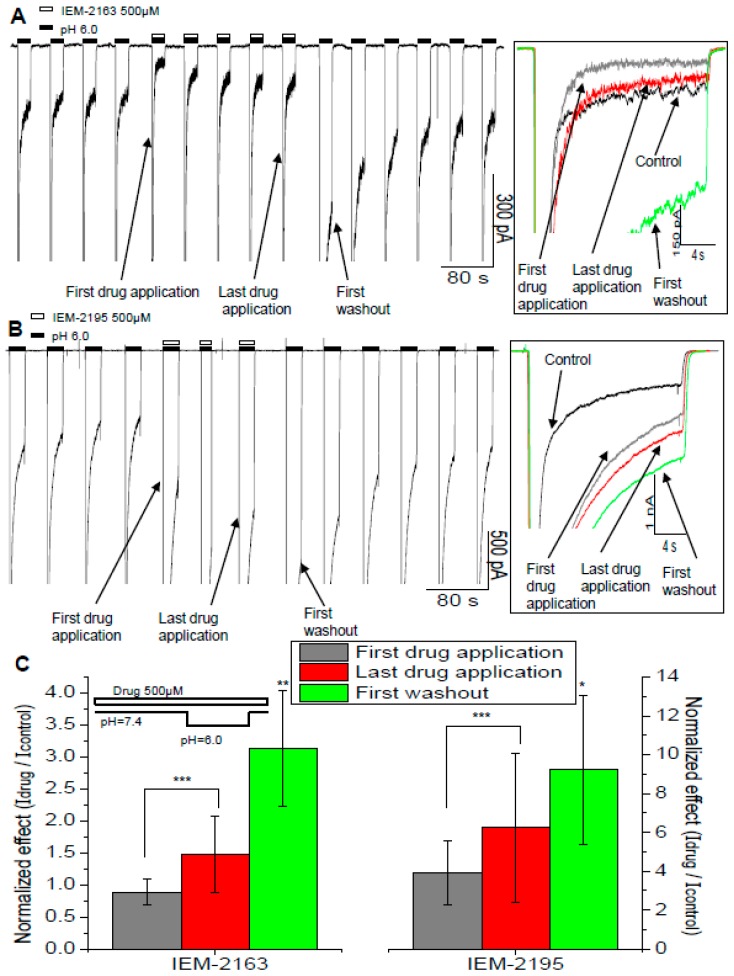
Figure 5.
Non-monotonic effect development and washout of IEM-2163 and IEM-2195. (A,B) Representative recordings of the time course of experiments with IEM-2163 (A) and IEM-2195 (B). To the right are overlaid responses from the main panel. (C) The effect was the most pronounced in the protocol of continuous application. Number of * denotes statistical significance at * p < 0.05, ** p < 0.01, or *** p < 0.001, respectively, n ≥ 5. The average values were calculated as the ratio of amplitudes for the first drug application, last drug application, and first washout to the last control response, respectively.

