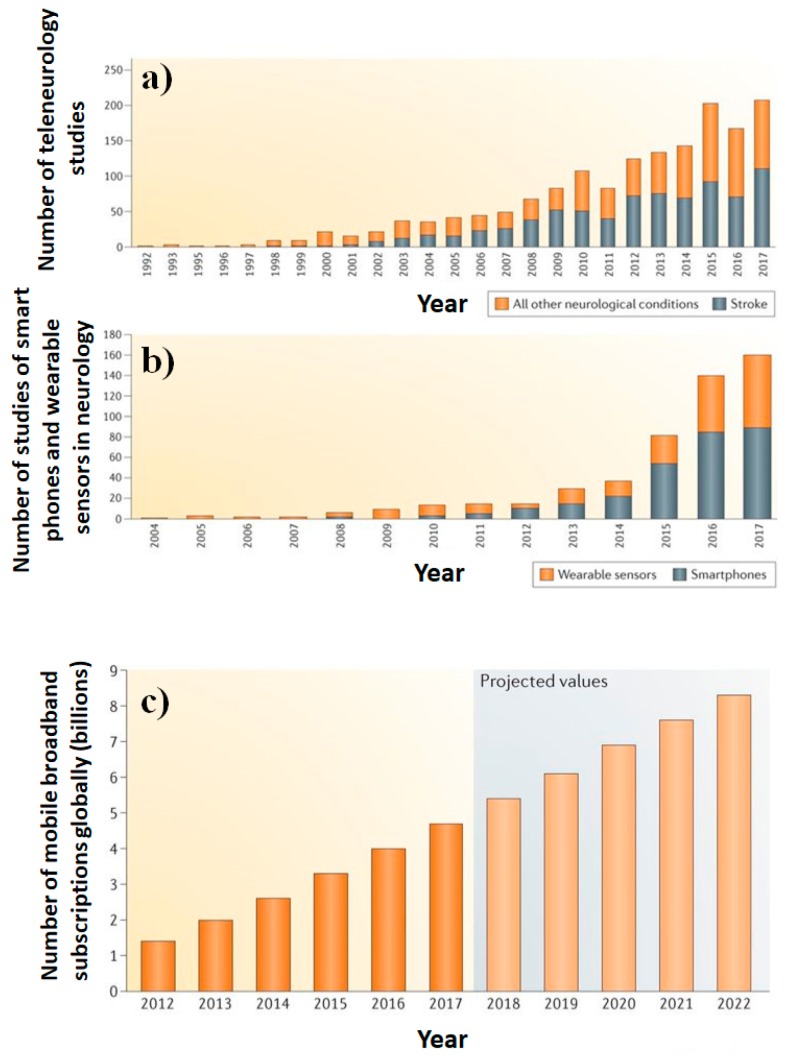
Figure 7.
Proliferation of teleneurology studies. (a) A graph showing the volume of published studies of telehealth and care delivery for stroke (grey) and other neurological conditions (orange) from 1992 to 2017, as listed on PubMed. The past two decades have seen a substantial increase in the volume of these studies. (b) A graph showing the volume of published studies of smartphones (grey) and wearable sensors (orange) for neurological conditions from 1992 to 2017, as listed on PubMed. Few studies were conducted before 2015, but the number has since increased exponentially. (c) The number of mobile broadband subscriptions, globally. A graph of smartphone ownership (measured by a number of global broadband subscriptions) from 2012 to 2022. Smartphone (Ericsson Mobility Report, 2017) ownership rates have steadily increased; by 2020, 70% of the world’s population is projected to own a smartphone (images reproduced from [22] with copyright permission from Nature Review: Neurology).

