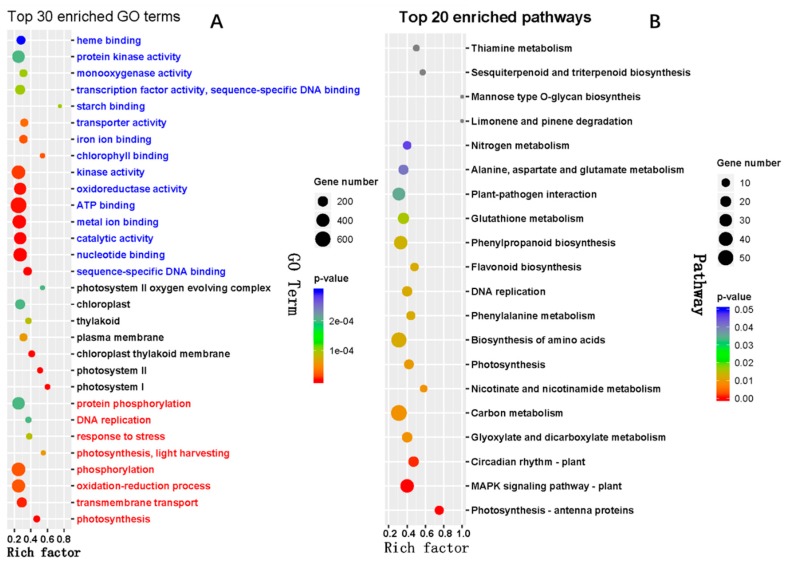
Figure 5.
GO (A) and KEGG (B) functional classifications of differentially expressed genes (DEGs). Rich factor represents the ratio of the number of DEGs over the total number of genes in the specific GO term or KEGG pathway. The GO terms in red, black, and blue belong to biological processes, cellular components, and molecular functions, respectively.

