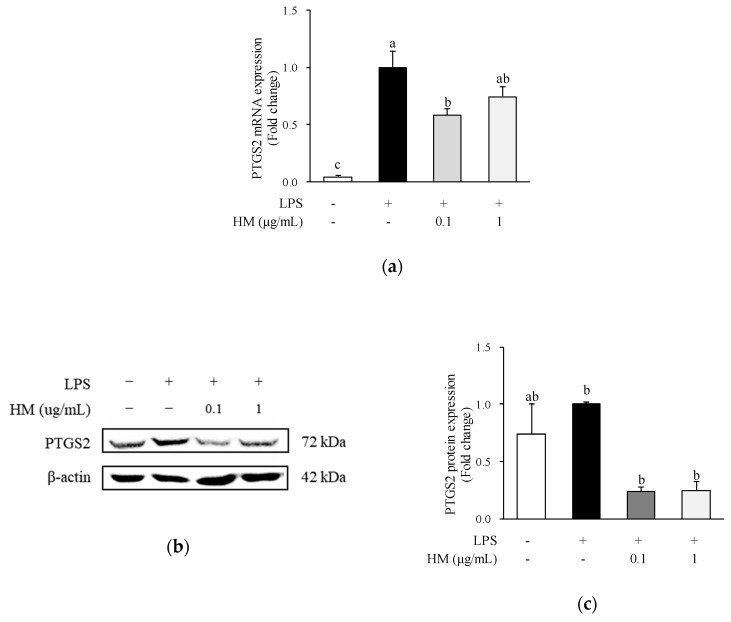
Figure 4.
Effects of HM on protein and mRNA expression of PTGS2 in RAW264.7 cells. Cells were pre-incubated with indicated concentrations of HM for 1 h and then co-incubated with LPS (1 μg/mL) for 24 h. (a) PTGS2 mRNA levels were determined by qRT-PCR. (b) Representative images of western blots. (c) PTGS2 protein levels quantified by ImageLab software. Values are expressed as mean ± SEM (n = 4). Different superscript letters indicate statistical significance (p < 0.05). PTGS2, prostaglandin-endoperoxide synthase 2; LPS, lipopolysaccharide; HM, high hydrostatic pressure extract of mulberry fruit.

