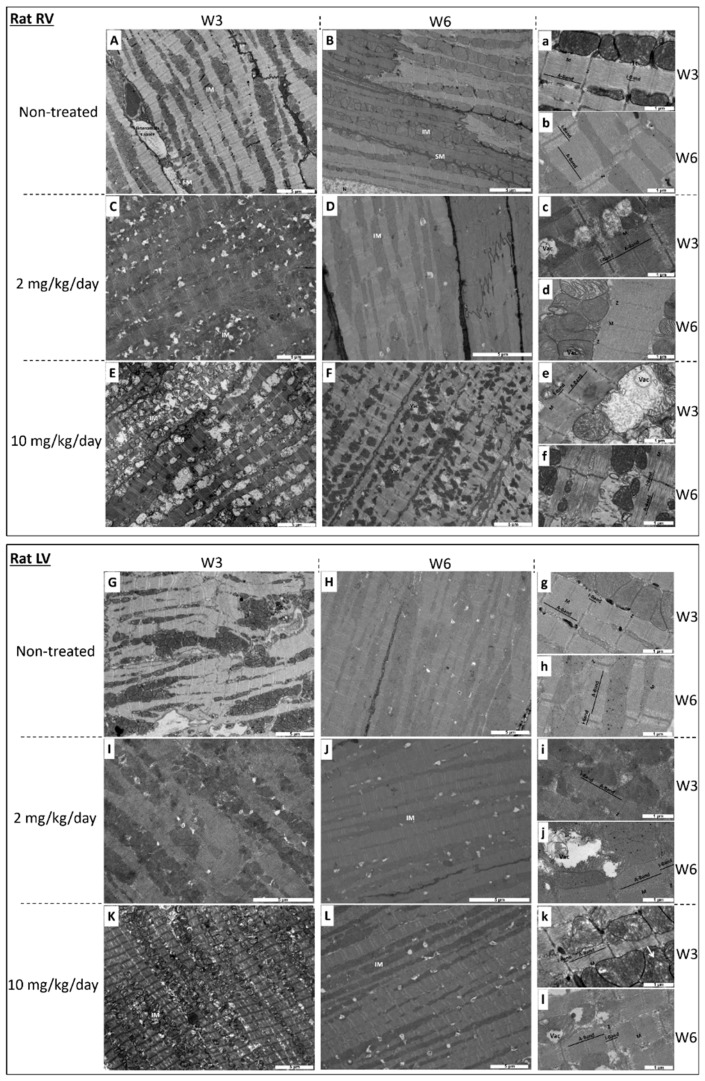
Figure 1.
Transmission electron micrograph of right ventricle (RV) and of the left ventricle (LV) in rats at week 3 (W3) (A,a,C,c,E,e for RV and G,g,I,i,K,k for LV) and at week 6 (W6) (3-weeks drug washout) (B,b,D,d,F,f for RV and H,h,J,j,L,l for LV). (A,a,B,b,G,g,H,h): non-treated rats. (C,c,D,d,I,i,J,j): 2 mg I-BET-151/kg/day treated rats. (E,e,F,f,K,k,L,l): 10 mg I-BET-151/kg/day treated rats. SM indicates sub-sarcolemmal mitochondria; IM, interfibrillar mitochondria; Vac, vacuole; Tt, T tubule; M, M line; Z, Z line. Bar scale is indicated on each micrograph. Selection of the most representative pictures from three animals per group.

