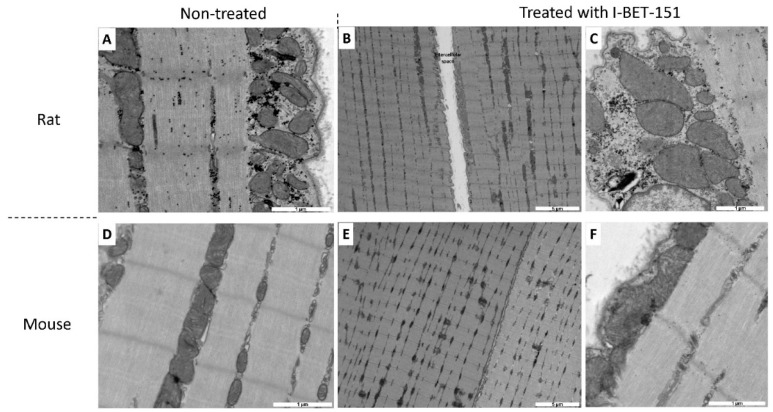
Figure 3.
Transmission electron micrograph of non-treated (A,D) and treated (B,C,E,F) rat (A–C) and mouse (D–F) skeletal muscle. Rats were treated with 10 mg/kg/day of I-BET-151 while mice were treated with 50 mg/kg/day of I-BET-151. Bar scale is indicated on each micrograph. Selection of the most representative pictures from three animals per group.

