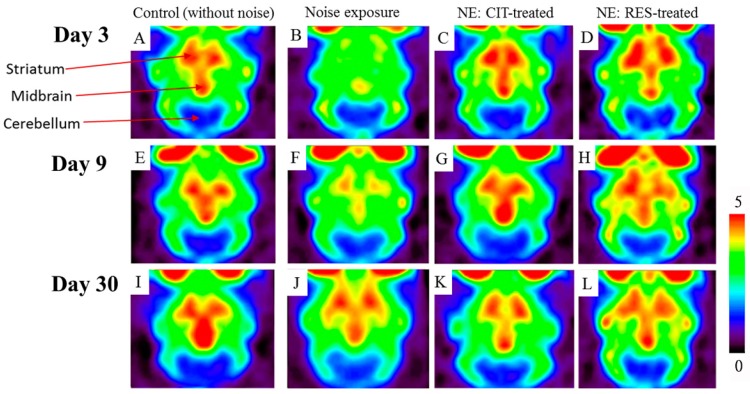
Figure 2.
4-[18F]-ADAM/small-animal PET images of transverse sections are displayed. Images were acquired from the control group (A,E,I), NE group (B,F,J), CIT-treated group (C,G,K), and RES-treated group (D,H,L) on day 3 (A–D), day 9 (E–H), and day 30 (I–L). The PET images from the NE group clearly portray less 4-[18F]-ADAM uptake relative to the other groups on days 3 and 9. The color scale for all images was adjusted by the standardized uptake value of cerebellum as reference region. The standardized uptake value ratio is the unit of the color scale (0~5). (CIT: citalopram, RES: resveratrol, NE: noise exposure, PET: positron emission tomography).

