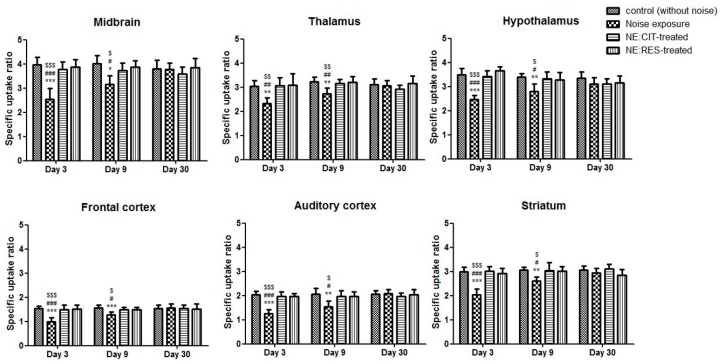
Figure 3.
The graphs portray the SURs of 4-[18F]-ADAM/micro-PET on days 3, 9, and 30 in six brain regions. The SURs of 4-[18F]-ADAM were significantly lower in the NE group compared with the control group and the CIT-/RES-treated groups on days 3 and 9. There were no significant differences among the groups on day 30. * p < 0.05, ** p < 0.01, *** p < 0.001 for comparisons between the control group and NE group; $ p < 0.05, $$ p < 0.01, $$$ p < 0.001 for comparisons between the NE group and CIT-treated group; # p < 0.05, ## p < 0.01, ### p < 0.001 for comparisons between the RES-treated group and NE group. (SUR: specific uptake ratio, CIT: citalopram, RES: resveratrol, NE: noise exposure).

