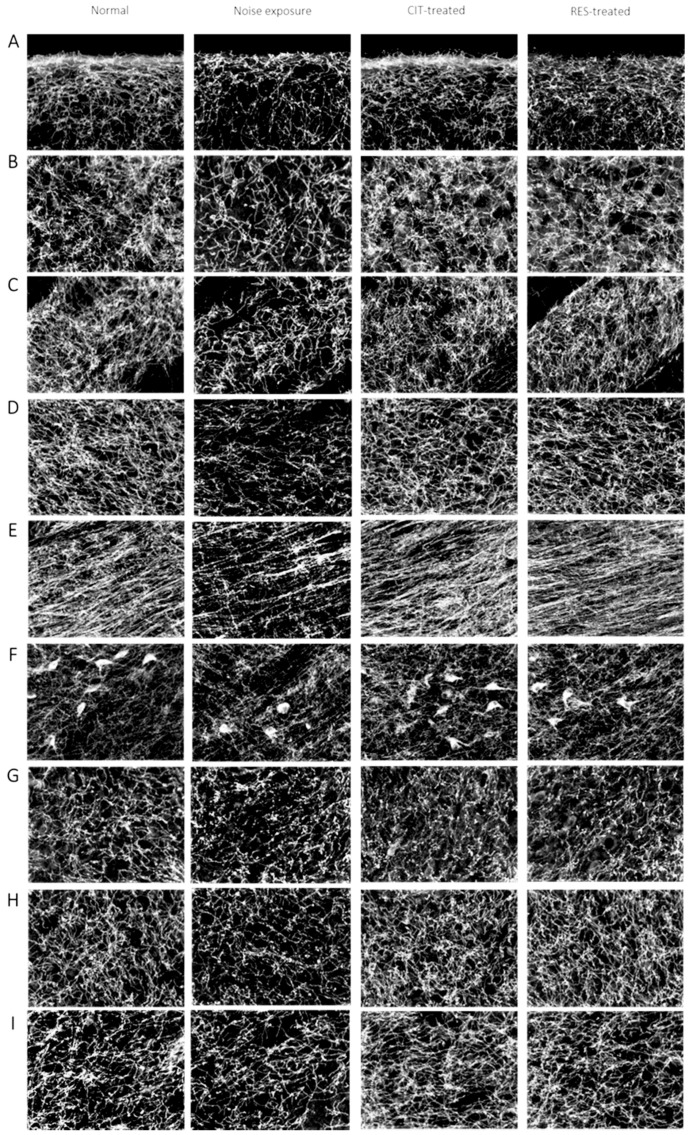
Figure 4.
Photomicrographs of serotonin transporters following immunohistochemistry staining in various brain regions of the control group, the NE group, the CIT-treated group, and the RES-treated group 4 days after noise exposure are displayed. The serotonergic fiber densities in various brain regions were lower in the NE group. (A) frontal cortex; (B) auditory cortex; (C) striatum; (D) thalamus; (E) hypothalamus; (F) raphe nucleus; (G) cochlear nucleus; (H) inferior colliculus; and (I) hippocampus. (CIT: citalopram, RES: resveratrol, NE: noise exposure).

