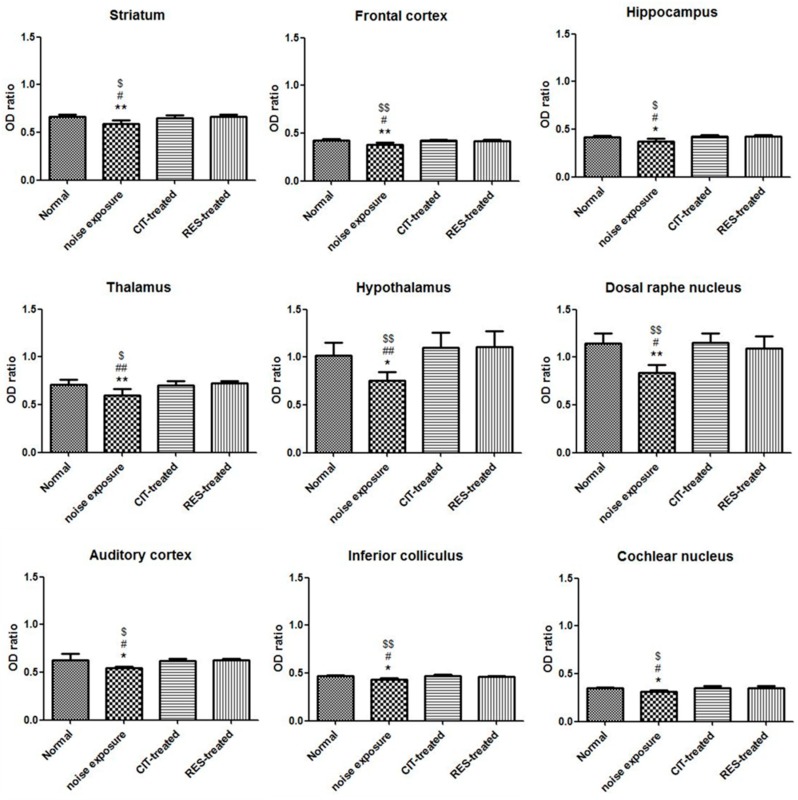
Figure 5.
The graphs display OD ratios in various brain regions at day 4 after noise exposure. The OD ratios in various brain regions were significantly lower than those of the NE group. * p < 0.05, ** p < 0.01, *** p < 0.001 for comparisons between the control group and NE group; $ p < 0.05, $$ p < 0.01, $$$ p < 0.001 for comparisons between the NE group and CIT-treated group; # p < 0.05, ## p < 0.01, ### p < 0.001 for comparisons between the RES-treated group and NE group. (OD: optical density, CIT: citalopram, RES: resveratrol, NE: noise exposure).

