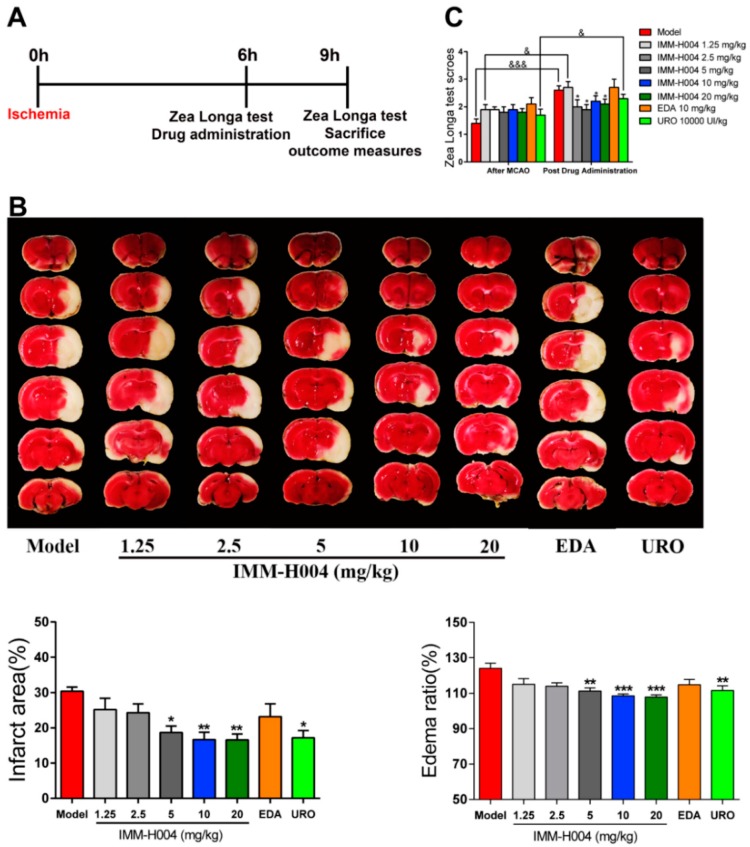
Figure 2.
Therapeutic dosage window experiment of IMM-H004. (A) The timeline diagram of theraputic dosage window experiment. (B) Representative images of TTC staining, and analysis of infarction area and edema ratio. (C) Statistical analysis of Zea Longa test scores. Data are shown as the mean ± SD (n = 10/group). * p < 0.05 vs. model; ** p < 0.01 vs. model; *** p < 0.001 vs. model; & p < 0.05 vs. after MCAO; &&& p < 0.001 vs. after MCAO.

