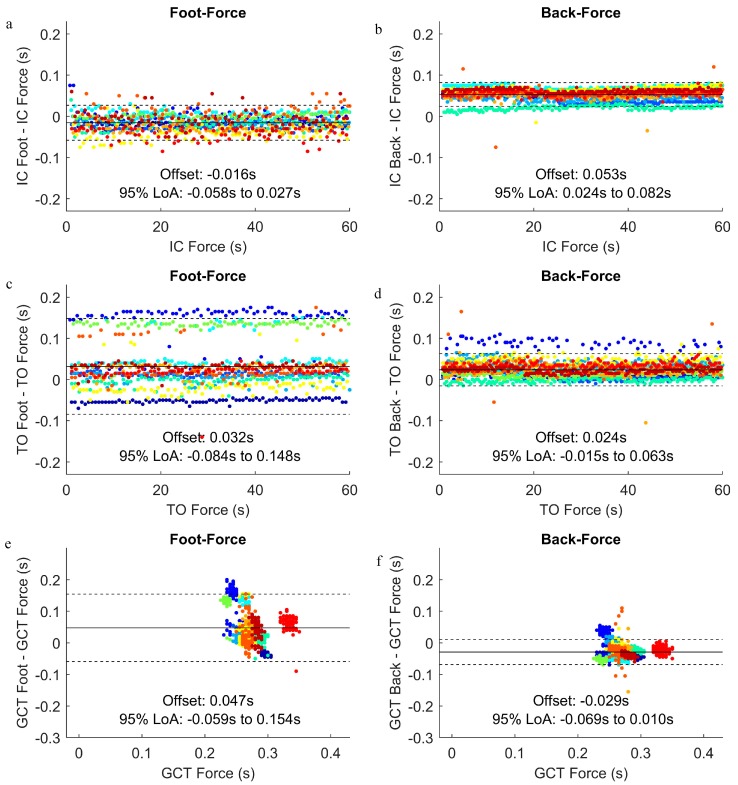
Figure 7.
Bland-Altman plots and 95% limits of agreement between the accelerometer-based and force plate-based identification of IC, TO, and GCT over the course of a 60 s running trial. Each dot represents one gait event (IC of TO) or step (GCT), and each participant is plotted with a unique color. The data were processed using a sampling rate of 200 Hz, window size of 2 s, and change in window start time of 0.02 s. The plots are provided for (a) IC, foot-force comparison; (b) IC, back-force comparison; (c) TO, foot-force comparison; (d) TO, back-force comparison; (e) GCT, foot-force comparison; (f) GCT, back-force comparison.

