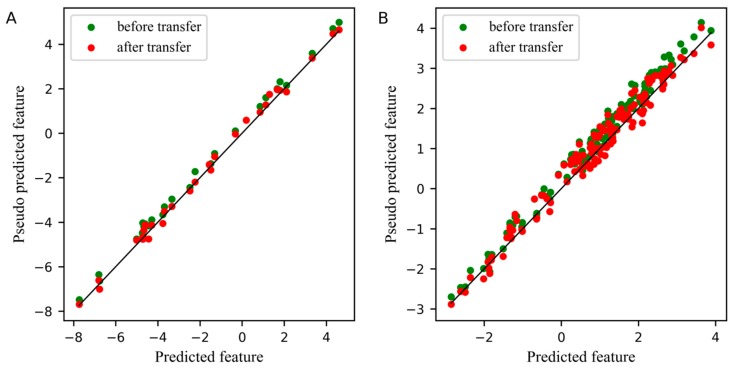
Figure 7.
Plot for the differences between the feature before and after transfer in the PLS subspace. (A) The differences of the first pseudo predicted feature of slave instrument standard set before and after transfer in PLS subspace, (B) The differences of the first pseudo predicted feature of slave instrument test set before and after transfer in PLS subspace.

