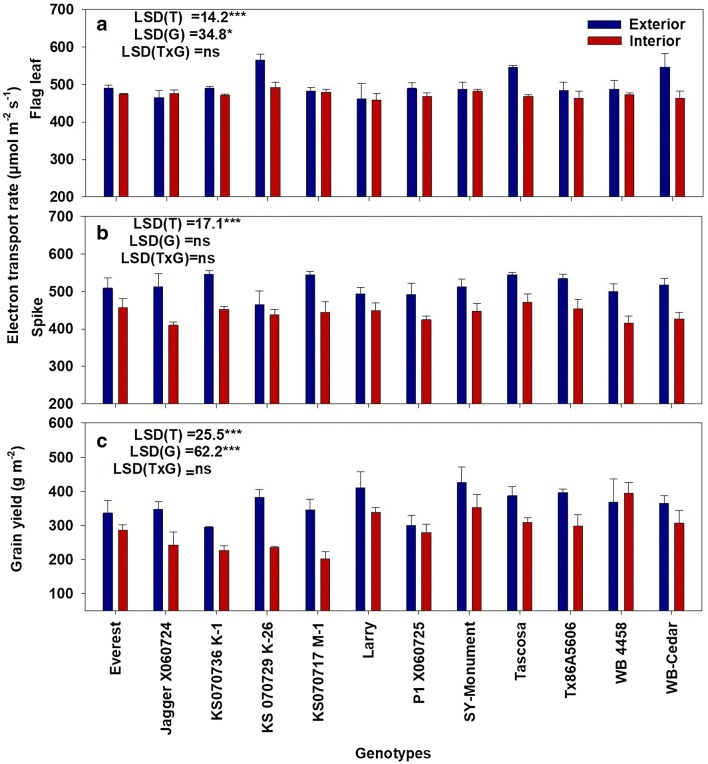
Fig. 8.
Physiological and yield response to HNT. Flag leaf (a) and spike (b) electron transport rate recorded 7 days after treatment imposition and grain yield (c) of twelve winter wheat genotypes under exterior (control) and interior (HNT treatment) conditions. Analysis of variance with least significant difference (LSD) is presented for each trait. T treatment, G genotype, ns non-significant. *P < 0.05; ***P < 0.001. Bars indicate mean ± standard error (n = 3)

