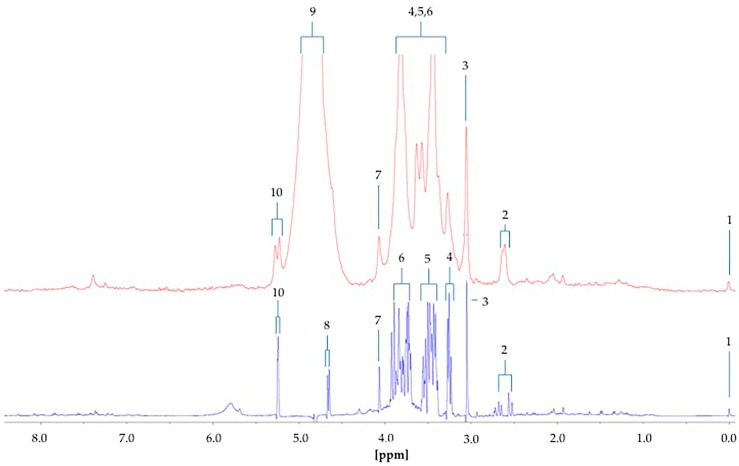
Figure 8.
Diabetic urinary 1H NMR profile acquired at 60 (red) and 400 MHz (blue) operating frequencies. Assignments: 1, TSP-Si(CH3)3; 2, Citrate-A/B-CH2CO2−; 3, Cn/Creatine > N-CH3; 4, β-Glucose-C2-H; 5, α- and β-Glucose-C4-H/C5-H, and α-Glucose-C2-H; 6, α- and β-Glucose-C3-H/C5-H/C6-H2; 7, Cn-CH2; 8, β-Glucose-C1-H; 9, H2O/HOD-OH; 10, α-Glucose-C1-H.

