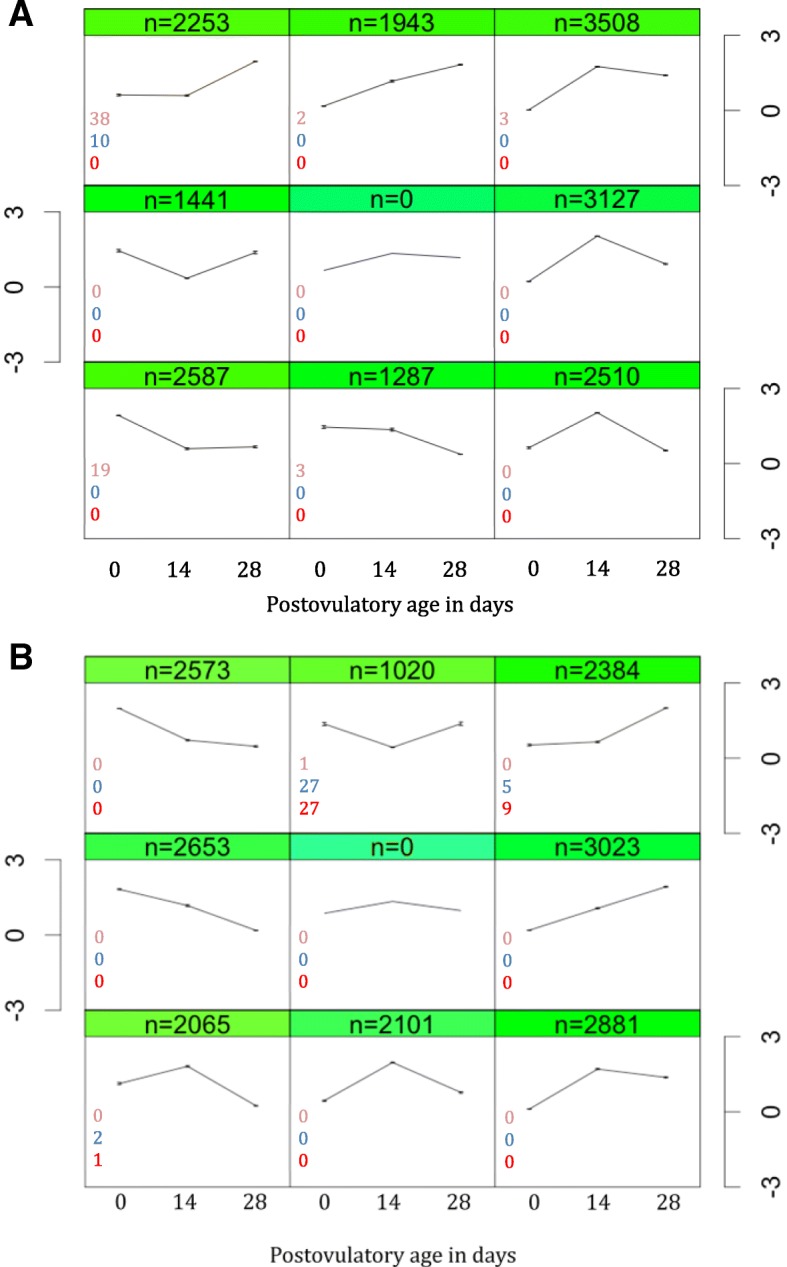
Fig. 2.

Dynamics of postovulatory transcriptome in Atlantic salmon egg obtained from a) good and b) poor egg quality group. Transcripts with similar expression pattern were clustered and represented by the scaled mean expression value at each sampling time. The dynamics of transcripts was obtained by self-organizing map clustering of individual transcripts at three time points: at the onset of ovulation, at 14, and at the 28 days post-ovulation (0dpo, 14dpo, and 28dpo, respectively). Number of differentially accumulated transcripts between the sampling time-points is shown for 28dpo vs 0dpo (orange), 28dpo vs 14dpo (blue) and 14dpo vs 0dpo (red) comparisons. The details of discrimination between the two quality groups are given in the text (see also Additional file 3). Y-axis is scaled expression level of transcripts. n is the number of transcripts showing a given expression pattern during the postovulatory aging. Nine different patterns for each egg quality group are displayed
