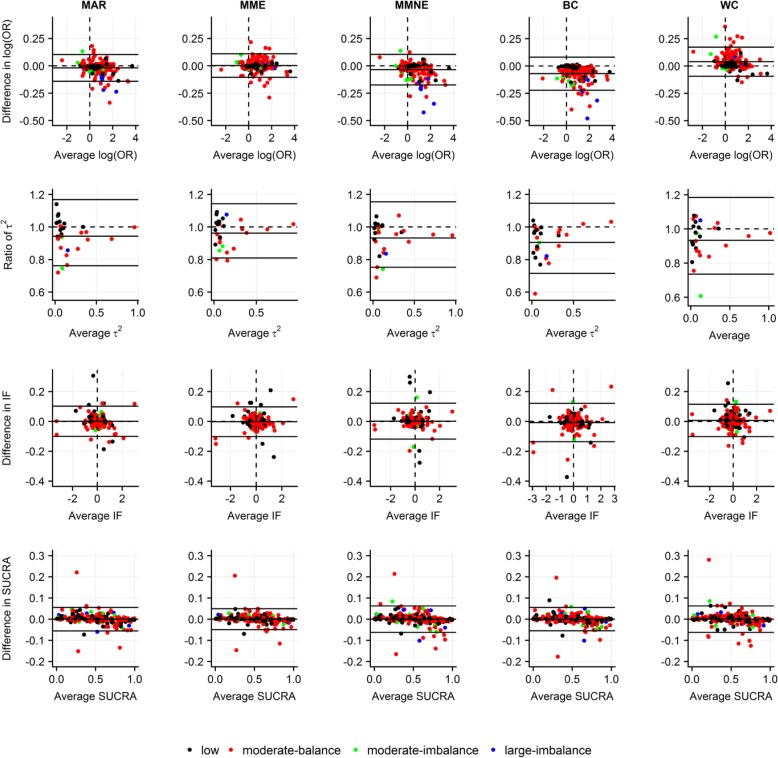
Fig. 3.
Bland-Altman plots on level of agreement between accountability and ignorance of uncertainty due to MOD under missing at random and four extreme scenarios in terms of posterior mean of log odds ratio for basic parameters (first row), posterior median of common between-trial variance (second row), posterior mean of inconsistency factors (third row) and posterior mean of SUCRA values (fourth row). Use of identical, intervention-specific, normal prior distribution on log IMORs with moderate and zero prior variance to reflect accountability and ignorance of uncertainty due to MOD, respectively. Different colors indicate extent and balance of MOD across 29 networks (17 networks with at least one closed loop). BC, best-case scenario; IF, inconsistency factor; MAR, missing at random; MME, more missing cases are events in all interventions; MMNE, more missing cases are non-events in all interventions; OR, odds ratio; SUCRA, surface under cumulative ranking; WC, worst-case scenario

