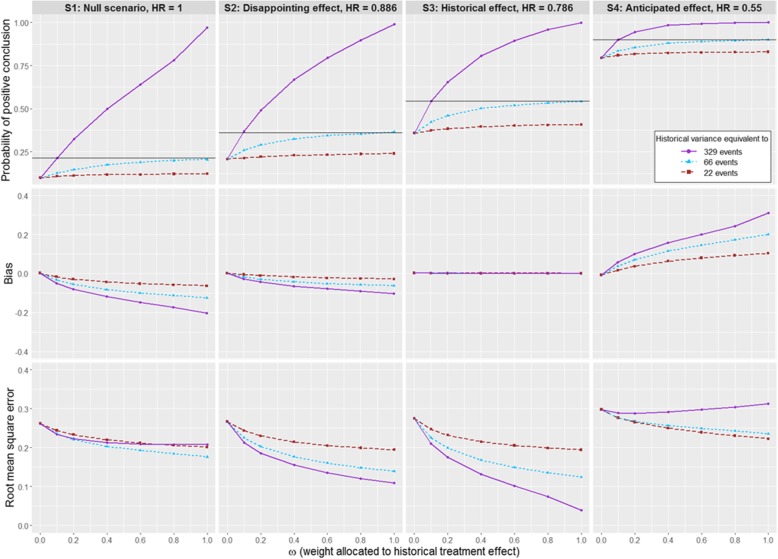
Fig. 5.
Impact of ω, for α0 = 0, on the operating characteristics for scenarios S1 to S4. A Weibull distribution is used for the historical and new data. We assume here commensurability between historical and new control arm, with various values of equivalent to 329, 66 and 22 events, The horizontal line represents the metric for α0 = 0 and ω = 0.1

