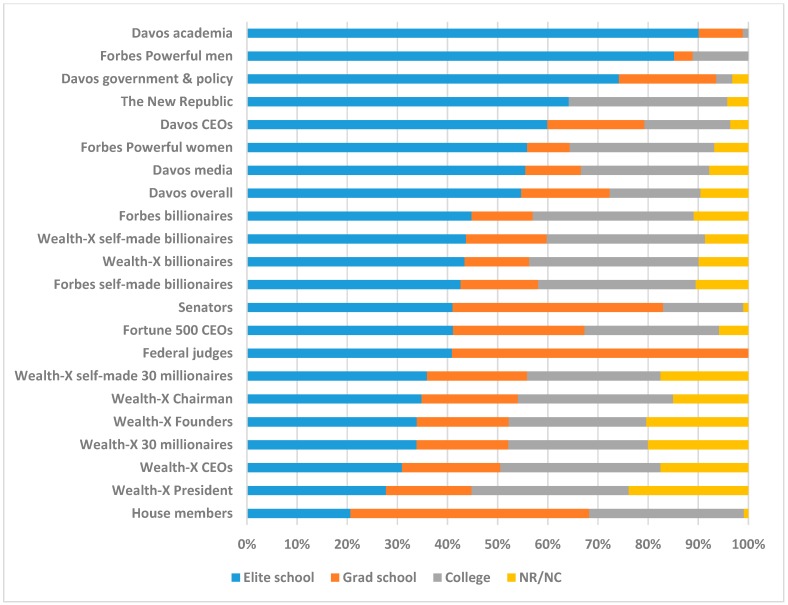
Figure 2.
Elite school attendance and general ability level of U.S. occupationally select groups. Blue bars: The percentage of each occupationally selective U.S. group that attended an “Elite school” (undergraduate or graduate) and were in the top 1% of general cognitive ability. Orange bars: The percentage that attended a “Grad school” independent of the Elite school category. Gray bars: The percentage attending “College” independent of the Grad school and Elite school categories. Yellow bars: The percentage that did “not report” or had “no college.” Elite school + Grad school + College + NR/NC sum to 100%. Data were taken from multiple research papers and adapted for this figure focused on the U.S. [53,54,56,57].

