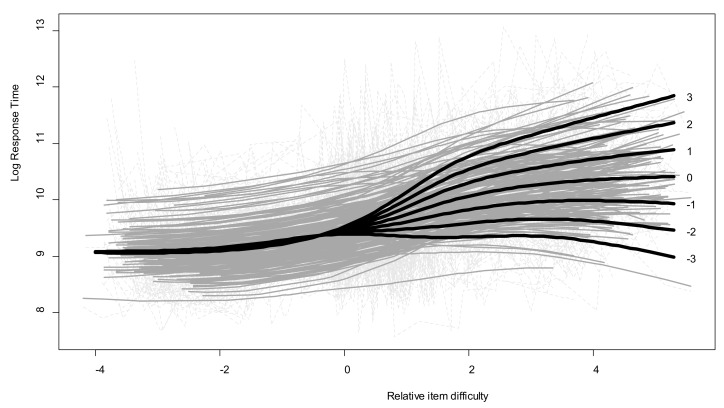
Figure 3.
Log.RTs by item difficulty and children’s expected ability for their age, with predicted values illustrating the GAMM results. Light-gray dotted lines: observed values; gray lines: individual fitted values; bold black lines: predicted values for a representative subset of individual relative ability parameters on the Rasch scale ranging from −3 to 3.

