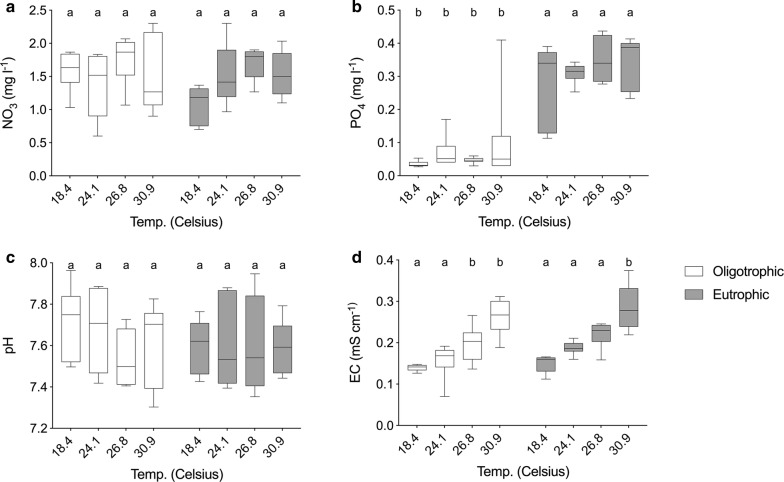
Fig. 2.
Overview of eutrophication variables (a, b) (NO3, PO4) and abiotic variables (c, d): pH; tds, total dissolved salts; EC (mV), electro conductivity in mS per cm. All data shown as the mean ± standard error (SE). Treatments with and without predators were merged in this table. Different letters indicate significant differences between treatments at α = 0.05

