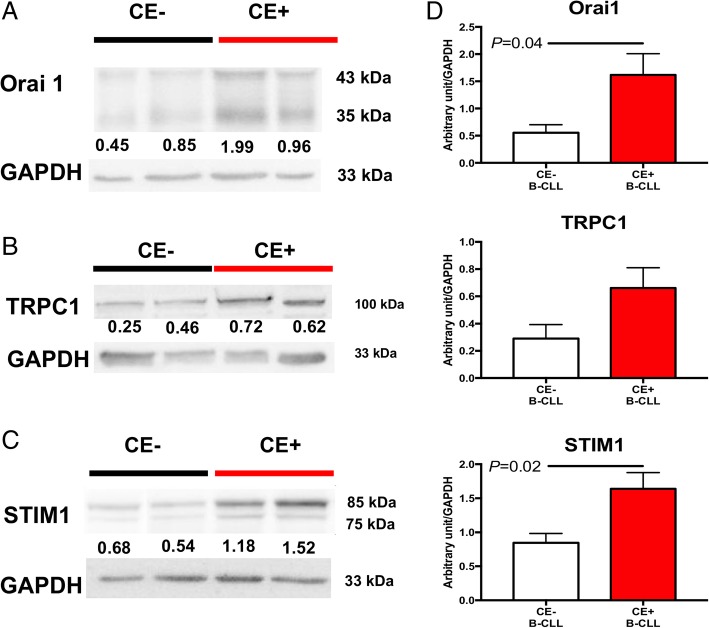
Fig. 4.
B-CLL cells from CE+ CLL patients (n = 11) display increased Orai1 and STIM1 protein levels compared with those from CE- CLL patients (n = 8). Left panels, representative Western blot images for Orai1(a), TRPC1 (b), and STIM1 (c). Quantification after normalization to GAPDH protein expression is depicted (d). P values are indicated when significant

