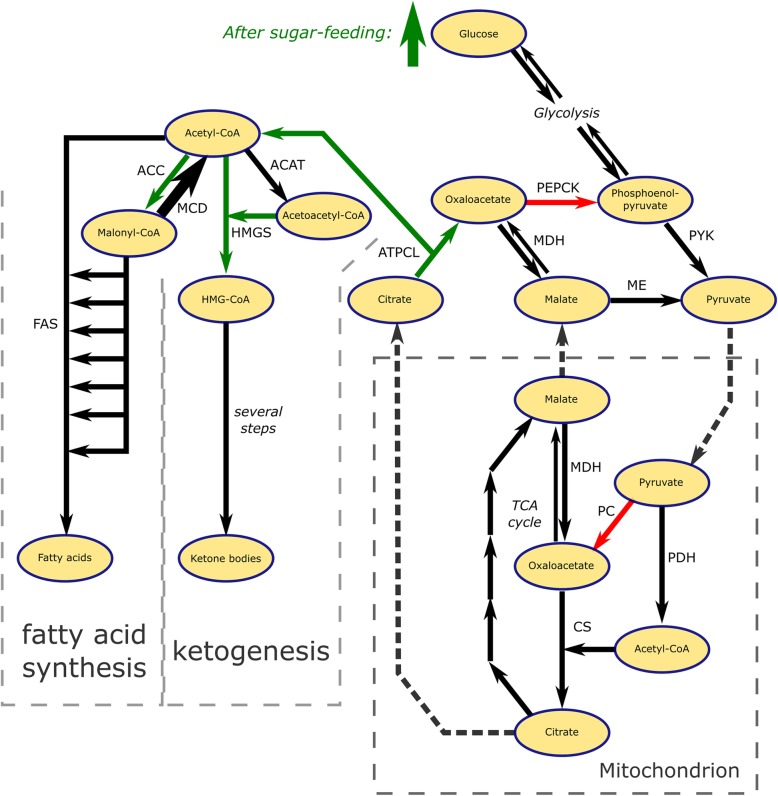
Fig. 3.
Differential gene expression in acetyl-CoA metabolism of N. vitripennis upon sugar feeding. Green and red arrows depict upregulated and downregulated genes, respectively. The thick arrow for MCD symbolize high constitutive expression. Dashed arrows represent transport of metabolites across the mitochondrial membrane

