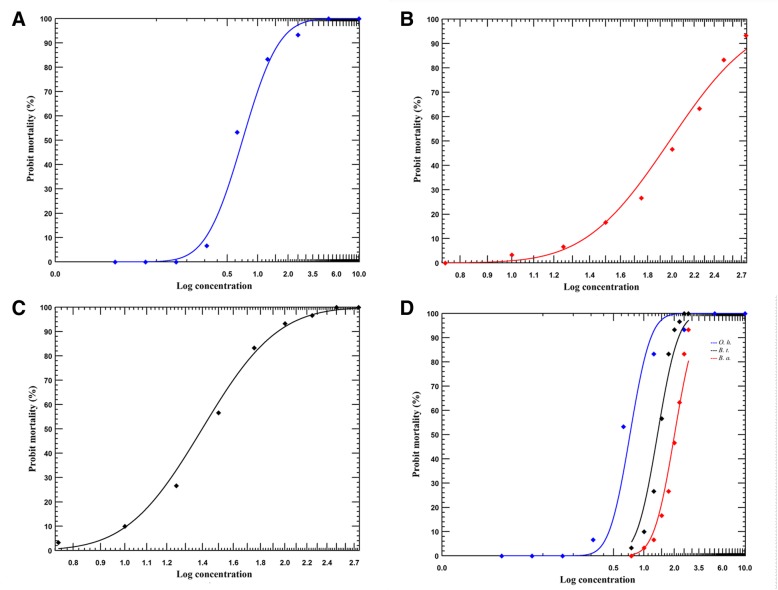
Fig. 3.
Dose-response curves of Oncomelania hupensis, Biomphalaria alexandrina, and Bulinus truncatus snails subjected to aqueous dilutions of 4% TDS for 24 h. a Oncomelania hupensis; b Biomphalaria alexandrina; c Bulinus truncatus; d The equality and parallelism of the regression lines of different snail species after 24 h exposure, tested by LR. O. h., Oncomelania hupensis; B. a., Biomphalaria alexandrina; B. t., Bulinus truncatus. The equality of the regression lines were tested using the likelihood ratio (LR). In general, there are significant differences between slopes and intercepts of lines (χ2 = 206, P < 0.05). The parallelism of slopes is tested by the LR. In general, there are significant differences between the regression lines (χ2 = 39.6, P < 0.05)

