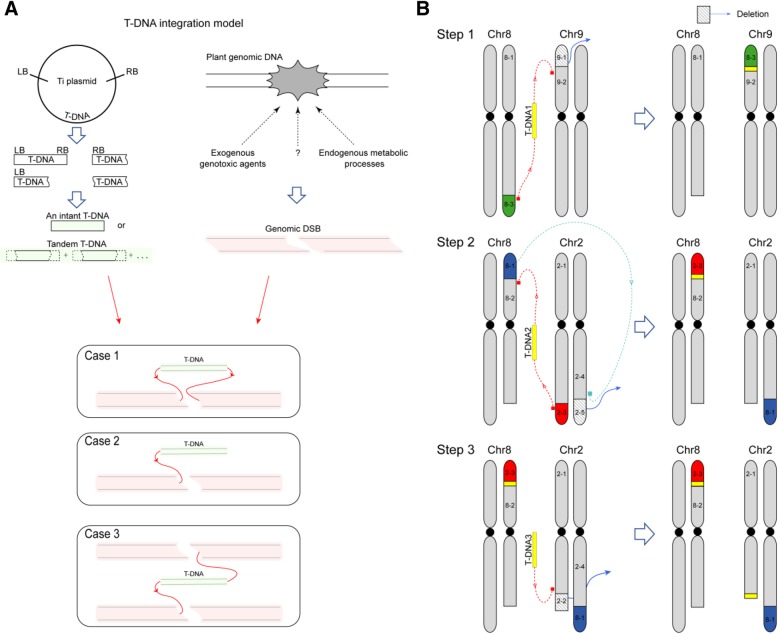
Fig. 6.
Diagram illustration of T-DNA integration model in the yl genome. a Overview of the three T-DNA integration models in yl genome. b Schematic diagram of the three T-DNA integrations which caused chromosomal translocation and/or deletion in the yl genome. Step 1 to step 3 indicated three T-DNA integrated into the yl genome, independently. T-DNA were marked in yellow. Dashed lines indicate rearrangements and arrows represent the direction of chromosomal rearrangement fragments. Chr8–3 (green), Chr8–1(blue), Chr2–3 (red) were translocated fragments. Chr2–2, Chr2–5 and Chr9–1 in diagonal stripe pattern were the deletion fragments

