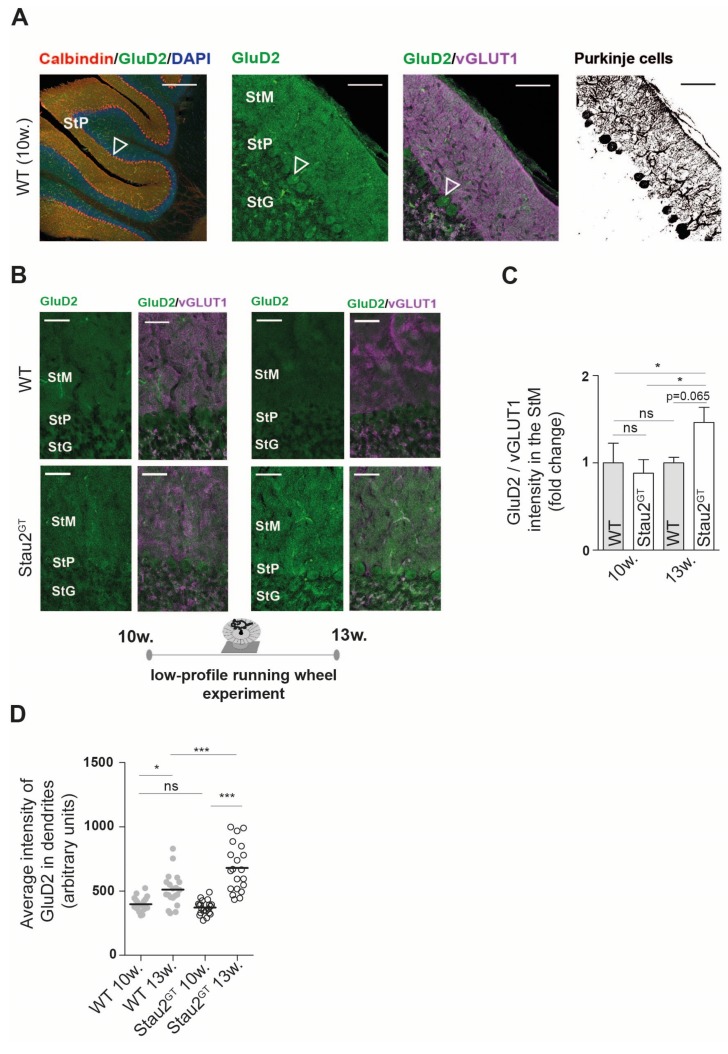
Figure 4.
Dendritic GluD2 protein expression increases in adult Stau2GT mice after motor activity. (A) Representative confocal images of immunofluorescent staining against GluD2, (vesicular glutamate transporter 1) vGLUT1, and calbindin (negative conversion for Purkinje cell morphology) on frontal sections of the cerebellum taken from 5-month-old WT mice. Scale bar = 200 µm (left), 100 µm (middle, right); arrow points to Purkinje cell bodies. (B) Representative confocal images of immunofluorescent staining against GluD2 and vGLUT1 in the Stau2GT and WT mice before and after exposure to the running wheel (setup Figure 3). Scale bar = 40 µm. (C) Quantification of the mean staining intensity of GluD2 normalized to the mean staining intensity of vGLUT1 before (10 w. = mice at the age of 10 weeks) and after (13 w. = mice at the age of 13 weeks) 3 weeks of voluntary wheel running. N = 3. Statistics: Student’s t-test. Mean + SEM. (D) Histogram showing the average intensity of the GluD2 signal in calbindin-positive cerebellar Purkinje cell dendrites before (10 w.) and after (13 w.) running wheel exposure. The WT (filled grey circles) and Stau2GT mice (empty black circles). N = 20 dendritic stretches in each group, from three different animals. Statistics: One-way ANOVA and Bonferroni’s multiple comparison. Mean +SEM, * p < 0.05, ** p < 0.01, *** p < 0.001; ns. = not significant. StM, stratum moleculare; StP, stratum pyramidale; and StG, stratum granulare.

