Figure 1.
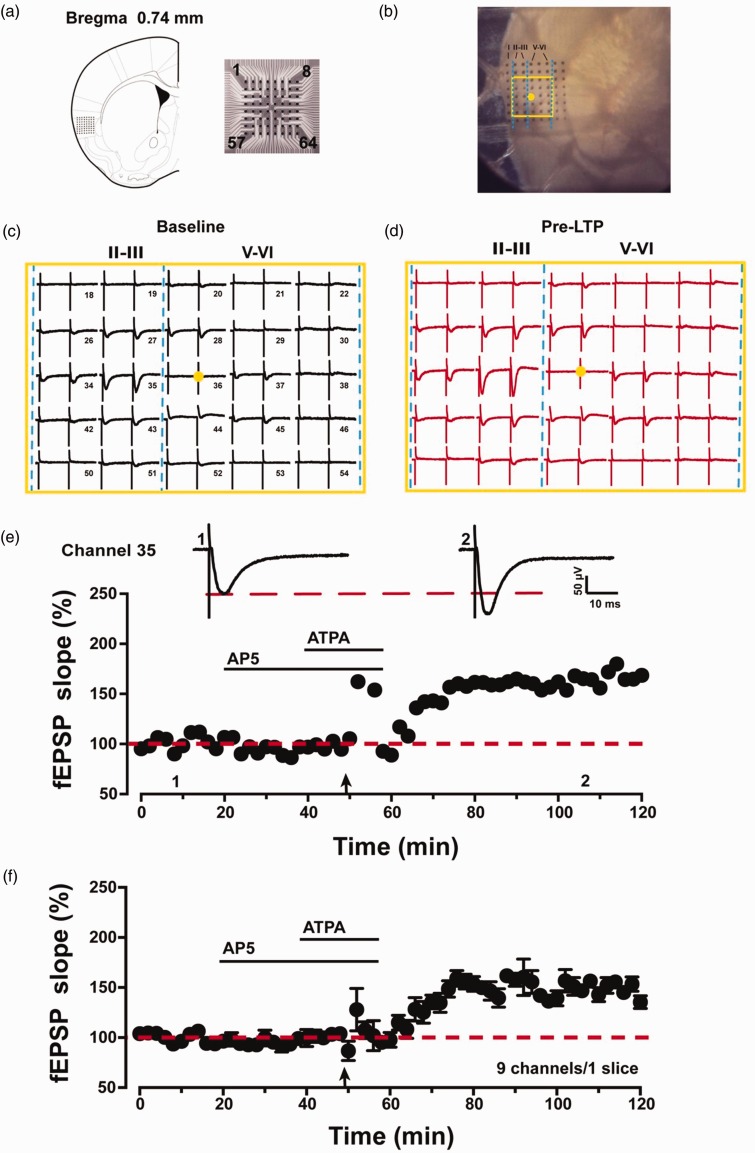
Spatial distribution and multisite synaptic responses of pre-LTP in the IC slice. (a) The location of MED64 probes on the IC slice (left, adapted from Paxinos and Franklin 2001, Bregma 0.74 mm) and the exhibition of the 8 × 8 electrodes (right). (b) Microscopic image of the MED64 probes on the IC slice. The yellow dot was the selected stimulation site and the yellow rectangle was the main activated region. (c) A general view of the spatial distribution of the potentials in all active channels within different layers (vertical lines) of one IC slice at baseline period. (d) An overview of the spatial distribution of the evoked potentials in all active channels across different layers (vertical lines) of one IC slice at 1 h after pre-LTP induction. (e) One sample trace and the time line of fEPSP slope for the pre-LTP are shown in one channel (channel 35). (f) The pooled time line of fEPSPs slopes of pre-LTP is shown in nine channels in one slice. Calibration: 50 μV, 10 ms. LTP: long-term potentiation; ATPA: amino-3–(3-hydroxy-5-tert-butylisoxazol-4-yl) propanoic acid; AP5: D(-)-2-amino-5-phosphonopentanoicacid; fEPSP: field excitatory postsynaptic potential.

