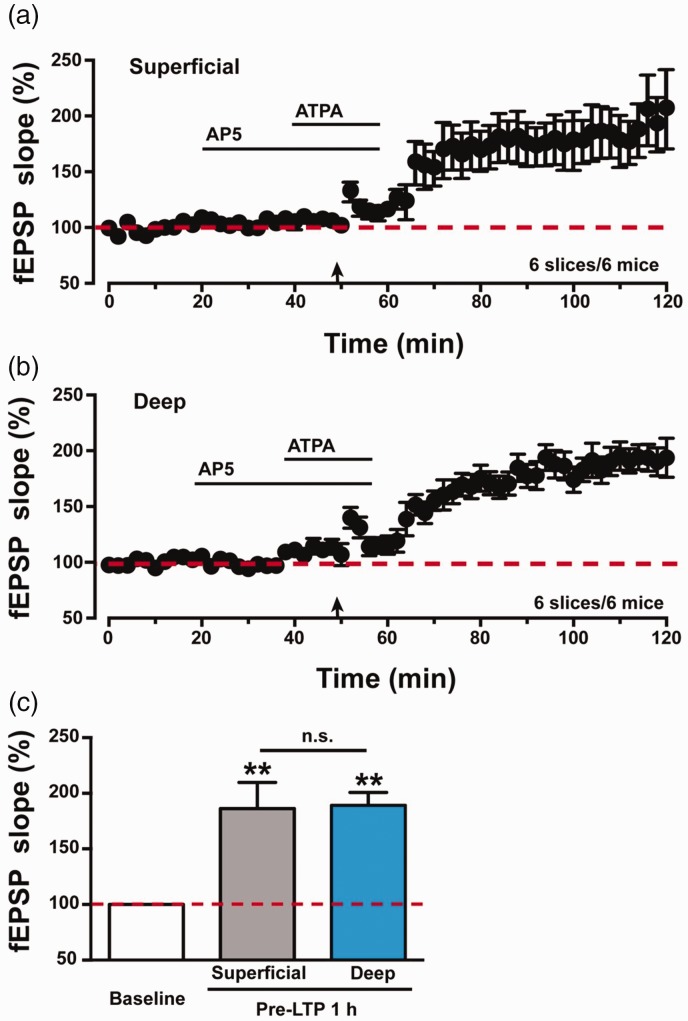
Figure 2.
Summarized data of pre-LTP in the IC of WT mice. (a) Pooled data show fEPSPs slopes of pre-LTP in the superficial layers of IC in WT mice (six slices of six mice). (b) Pooled data show fEPSPs slopes of pre-LTP in the deep layers of IC in WT mice (six slices of six mice). (c) Statistical data of fEPSPs slopes to illustrate the potentials in superficial and deep layers at 1 h after pre-LTP induction comparing with baseline level. There was no significant difference of fEPSPs slopes between superficial and deep layers at 1 h after pre-LTP induction. The dashed line indicated the mean basal synaptic responses. **p < 0.01 means comparing with baseline. n.s. means no significant difference, error bars indicated SEM. LTP: long-term potentiation; ATPA: amino-3–(3-hydroxy-5-tert-butylisoxazol-4-yl) propanoic acid; AP5: D(-)-2-amino-5-phosphonopentanoicacid; fEPSP: field excitatory postsynaptic potential.

