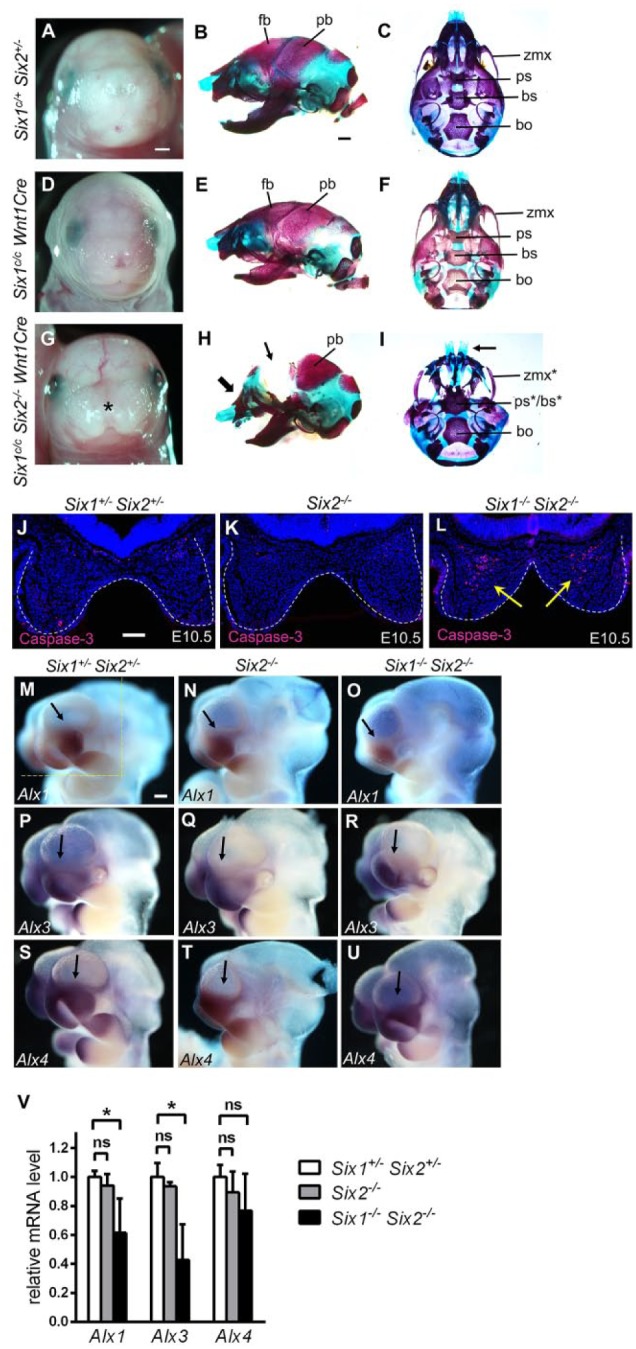
Figure 4.

Analyses of craniofacial defects in Six1c/cSix2–/–Wnt1Cre embryos and mechanisms underlying frontonasal defects in Six1–/–Six2–/– embryos. (A, D, G) Frontal view of E18.5 heads of the Six1c/+Six2+/– (A), Six1c/cWnt1Cre (D), and Six1c/cSix2–/–Wnt1Cre (G) embryos. (B, E, H) Lateral view of alizarin red– and Alcian blue–stained E18.5 head skeletons of the Six1c/+Six2+/– (B), Six1c/cWnt1Cre (E), and Six1c/cSix2–/–Wnt1Cre (H) embryos. (C, F, I) Ventral view of E18.5 head skeletons of the Six1c/+Six2+/– (C), Six1c/cWnt1Cre (F), and Six1c/cSix2–/–Wnt1Cre (I) embryos. Asterisk in G indicates midline facial cleft in the Six1c/cSix2–/–Wnt1Cre embryo. The thick arrow in H points to the abnormal shape of the nasal region, whereas the thin arrow points to the deficiency in frontal bones in the Six1c/cSix2–/–Wnt1Cre mutant. The arrow in I points to the midline facial cleft in Six1c/cSix2–/–Wnt1Cre mutant. The asterisk in the ps*/bs* and zmx* labels in Panel I points to malformation of those structures. Scale bar in A and B, 1 mm. (J–L) Representative frontal sections of E10.5 Six1+/–Six2+/– (J), Six2–/– (K), and Six1–/– Six2–/– (L) embryos showing immunofluorescent staining of active caspase-3 (red). White dashes outline the medial nasal processes. Arrows in L point to a large number of active caspase-3–positive cells in the medial nasal mesenchyme in the Six1–/– Six2–/– embryo. Scale bar in J, 100 µm. Multiple serial sections from 3 embryos of each genotype were analyzed. (M–U) Lateral view of patterns of Alx1 (M–O), Alx3 (P–R), and Alx4 (S–U) messenger RNA (mRNA) expression in the E10.5 Six1+/–Six2+/– (M, P, S), Six2–/– (N, Q, T), and Six1–/–Six2–/– (O, R, U) embryos. Arrow points to the lateral nasal process in each sample. At least 2 embryos of each genotype were analyzed using each probe. Scale bar in M, 200 µm. (V) Quantitative real-time polymerase chain reaction (RT-qPCR) analysis of the levels of expression of Alx1, Alx3, and Alx4 mRNAs in the E10.5 Six1+/–Six2+/–, Six2–/–, and Six1–/–Six2–/–embryos (n = 3 each). RT-qPCR analyses were performed using total RNAs extracted from microdissected facial tissues from the region of E10.5 embryos as marked by the yellow-dashed lines in panel M. The asterisk indicates significantly different expression levels (P < 0.05 by Student’s t test), whereas ns indicates no significant difference (P > 0.05 by Student’s t test). bo, basioccipital; bs, basisphenoid; fb, frontal bone; pb, parietal bone; ps, presphenoid; zmx, zygomatic process of maxilla.
