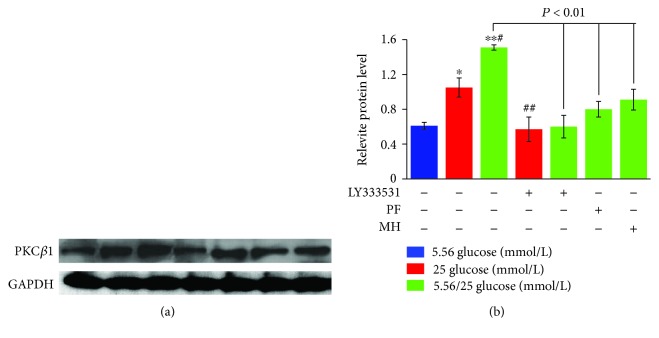
Figure 4.
Western blot analysis of PKCβ1 in the supernatant of human umbilical vein endothelial cells under different glucose concentrations. The band intensity was normalized to that of glyceraldehyde-3-phosphate dehydrogenase (GAPDH) (a), and the average band intensity after normalization is presented as a bar graph (b). ∗P < 0.05 and ∗∗P < 0.01 vs. glucose 5.56 mmol/L; #P < 0.05 and ##P < 0.01 vs. 25 mmol/L. PF: paeoniflorin; MH: metformin hydrochloride.

