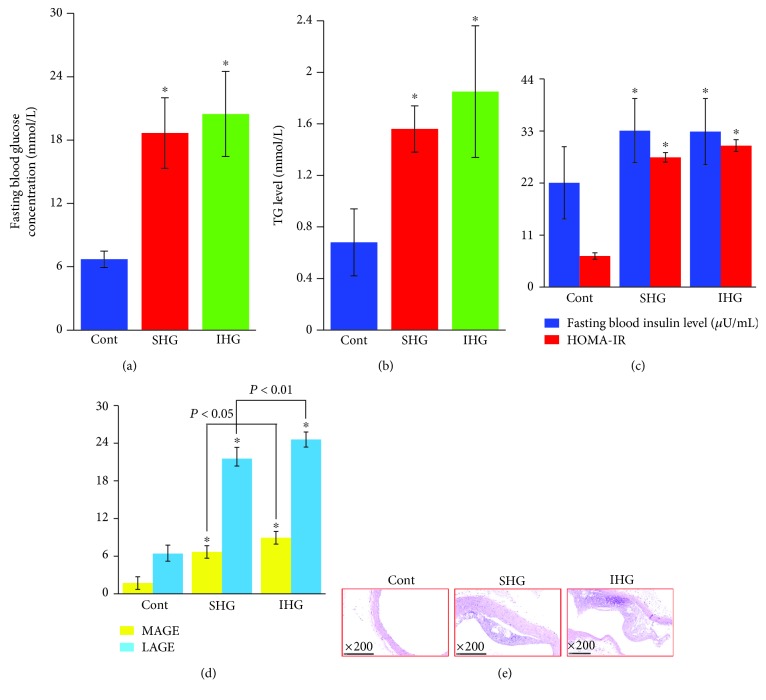
Figure 5.
Establishment of a blood glucose fluctuation rat model. (a) Fasting blood glucose concentration, (b) triglyceride (TG) levels, (c) fasting blood insulin level and homeostasis model assessment estimate of insulin resistance (HOMA-IR) index, and (d) mean amplitude glycemic excursions (MAGE) and largest amplitude glycemic excursions (LAGE). ∗P < 0.01 compared with control rats. (e) Representative images of histological examination of aorta in rats by H&E staining with 200x magnification. Cont: control; SHG: stable high blood glucose; IHG: intermittent high blood glucose.

