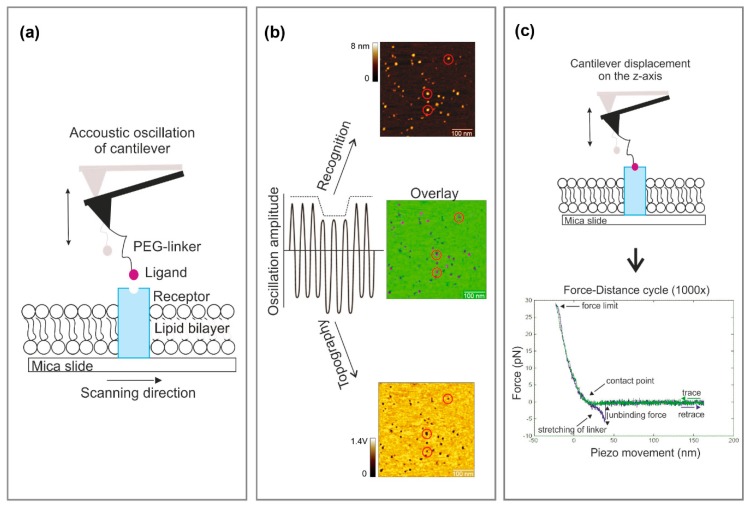
Figure 1.
Experimental setup of atomic force microscopy (AFM)-based force spectroscopy guided by recognition imaging. (a) Receptors reconstituted into a planar lipid bilayer spread on a mica surface. The cantilever is oscillated by acoustical excitation over the sample surface. (b) Simultaneous topographical and recognition (TREC) imaging. The oscillation amplitude is split into two parts. The upper part is taken to construct the recognition image, whereas the lower part is used for the topography image. Specific interaction of the tip-bound ligand with the receptor on the surface leads to a recognition event that is visible as a black dot in the recognition image (red circles). The overlaid image reveals a superposition of the recognition map on the topographical image. (c) The cantilever is placed over the functional receptor (i.e., molecules that generated recognition signal (red circles)) and the mode is switched to force spectroscopy. In this mode, the cantilever is repeatedly approached and retracted from the sample surface, resulting in continuous recordings of force–distance cycles. A typical ligand-receptor unbinding event arising from force-induced ligand/receptor dissociation appears as a parabolic-shaped downward signal. Specific unbinding lengths above 10 nm can be attributed to the elasticity of the receptors and the lipid membrane. PEG: Polyethylene glycol.

