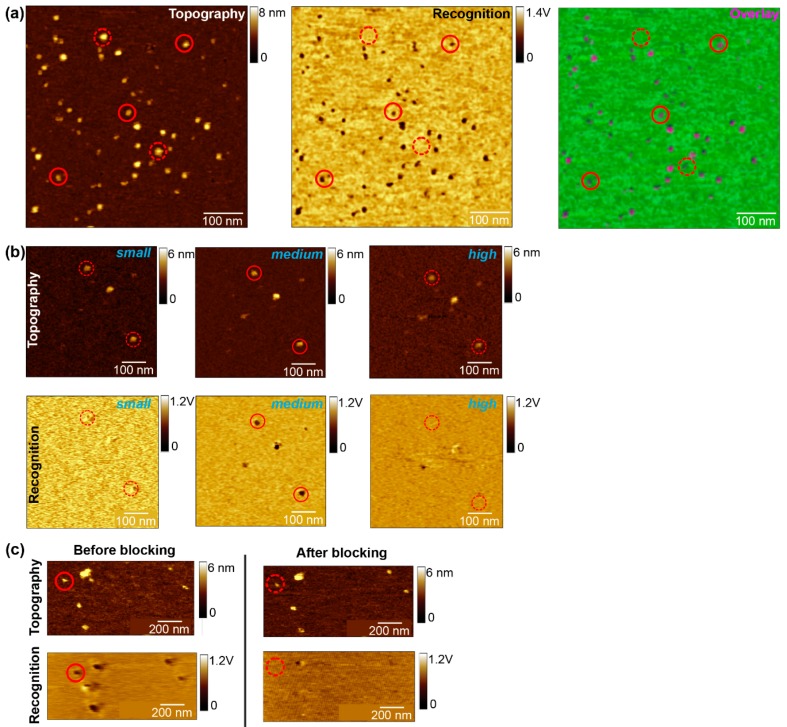
Figure 2.
Proof of concept: quantitative characterization of the binding mechanism between Uncoupling Protein 1 (UCP1) and its inhibitor adenosine triphosphate (ATP) (adapted from References [7,10]). First part of the combined experiment, simultaneous topography and recognition imaging to visualize specific interaction between UCP1 and ATP. (a) Topography, recognition, and overlay image. UCP1 molecules imaged with an ATP-tethered tip. Black dots in the corresponding recognition image arise from the decrease of the oscillation upwards peaks as a result from UCP1–ATP binding during recognition. The overlay image shows a superposition of the recognition map of UCP1–ATP binding domains (in pink) and the corresponding topography image. Color scale (green to pink) is 0–8 nm. (b) Specificity proof of UCP1–ATP interaction by amplitude block experiment. High resolution topographical (top row) and ATP recognition (bottom row) images of UCP1 recorded at different amplitudes. (c) Specificity of UCP1–ATP interactions tested by a surface block competition experiment. Topographic and recognition images before blocking of UCP1 (left column) and after UCP1 blocking (right column) by adding free ATP (4 mM) into the solution. (a–c) Solid and dashed circles indicate recognized and unrecognized protein molecules, respectively. Recognition events are shown in black. Image sizes: 600 × 600 nm.

