Figure 3.
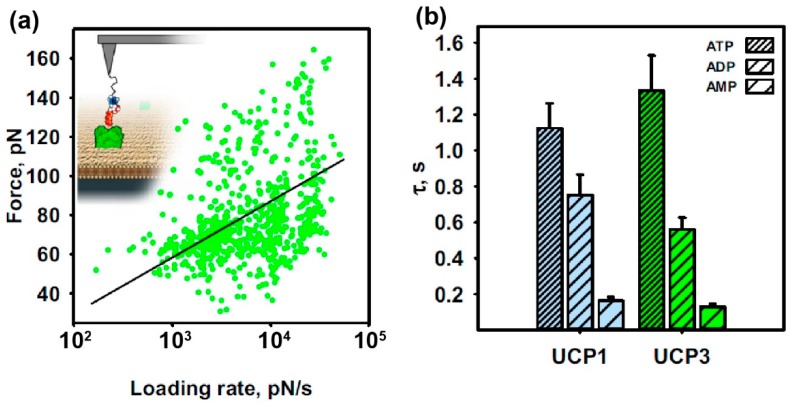
Proof of concept: quantitative characterization of the binding mechanism between UCP1 and its inhibitor ATP (adapted from References [7,10]). Dynamic force spectroscopy to study the binding forces between a pre-selected UCP molecule and its corresponding purine nucleotide (ATP, ADP, AMP). (a) Dynamic force spectroscopy plot for the UCP1–ATP interaction. Single-binding events between UCP1 and ATP are shown as green dots. After applying the Bell–Evans model (black line), the bond lifetime can be directly determined. (b) Application of this combined mode to other UCP-PN pairs: Dependence of bond lifetimes on PN-phosphorylation for UCP1-PN (blue) and UCP3-PN (green). Shown are the mean values ± SD of at least independent measurements, arising from the fit in (a).

