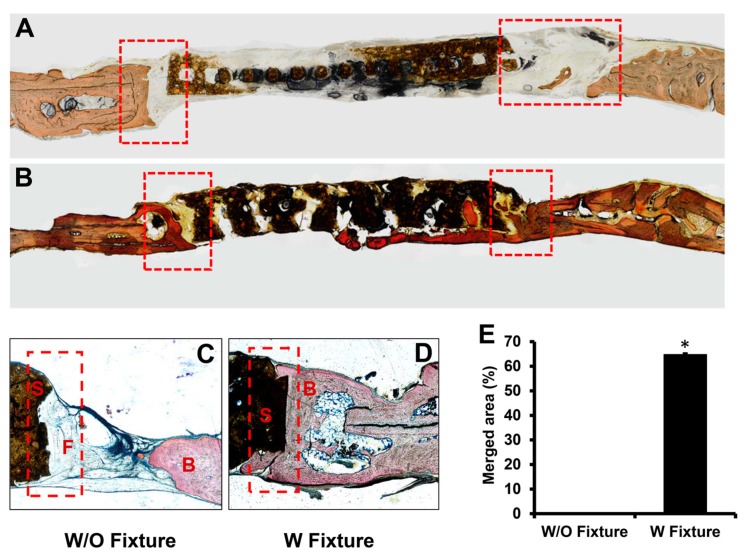
Figure 4.
Histological section of the area between host bone and scaffold after 12 weeks of implantation without (A,C) and with (B,D) fixture. Sections were stained with Stevenel’s Blue and Van Gieson’s stain after grinding process. Dotted rectangles represented region of interest (ROI). S: scaffold F: fibrous tissue and B: bone. The merged area between host bone and scaffold was quantified in percentage using Image J software, (n = 5, * p <0.05) (E).

