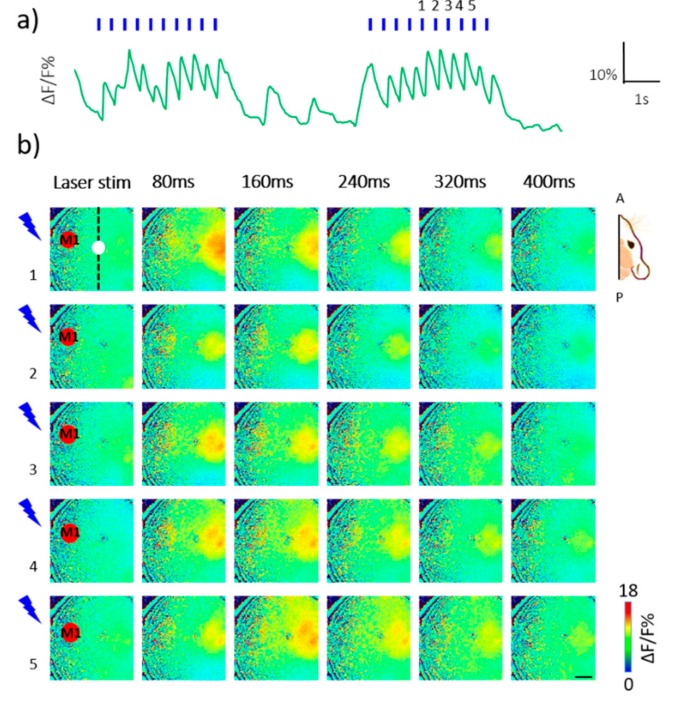
Figure 2.
Optogenetic inter-hemispheric stimulation. (a) Representative trace of optogenetically elicited cortical response in the right hemisphere during two train of stimulation from a single animal (2 Hz, 5 ms pulse duration); the blue lines represent laser stimulus. (b) Representative image sequence from the same recording in A, showing cortical activation in the right hemisphere elicited by 2 Hz pulse of a 473 nm blue laser stimulation in ChR2-expressing M1 in the left hemisphere. Each row corresponds to cortical activity triggered by a single pulse during 2 Hz stimulation. The vertical dashed line indicates the sagittal suture. The white spot on the vertical dashed line indicates the bregma. The red spot in the left hemisphere indicates the transfected M1. A, P: Anterior, Posterior. Scale bar: 1 mm.

