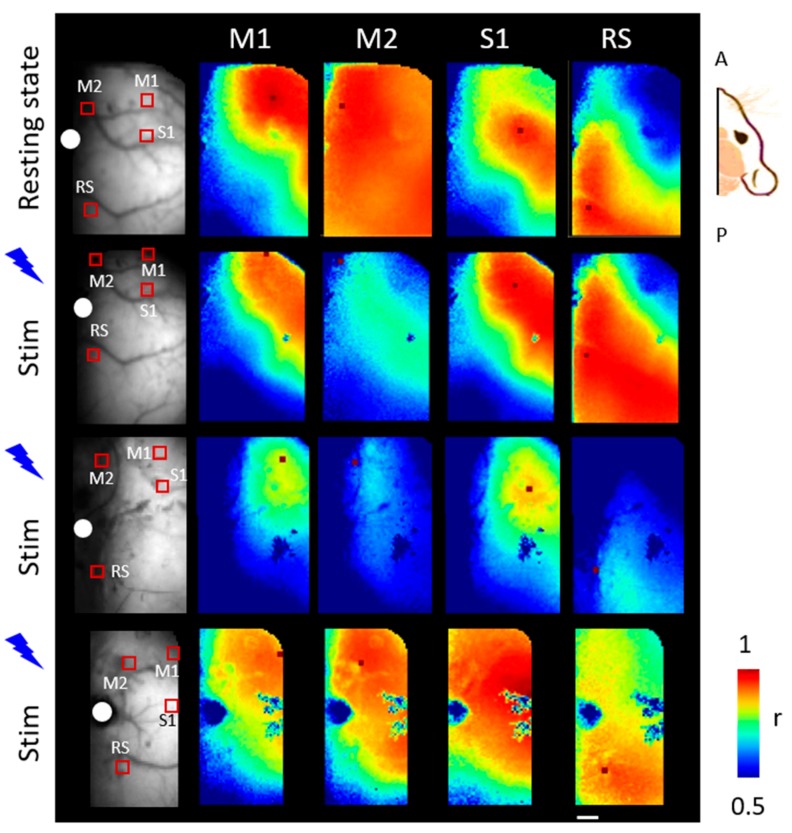
Figure 3.
Seed pixel correlation maps of activation during optogenetic stimulation. The panel shows averaged correlation maps for 3 animals, one for each row, during resting state (first row) and optogenetic stimulation. The first and second rows correspond to seed correlation maps of the same mouse during resting state and laser stimulation respectively. In the first column a raw image with the ROIs used for the correlation matrix analysis; the seed is within the ROI. We selected four cortical areas of interest (M1, M2, S1, RS, such as for primary motor cortex, secondary motor cortex, primary sensory cortex and retrosplenial area respectively). The white spot indicates bregma. A, P: Anterior, Posterior. Scale bar: 1 mm.

