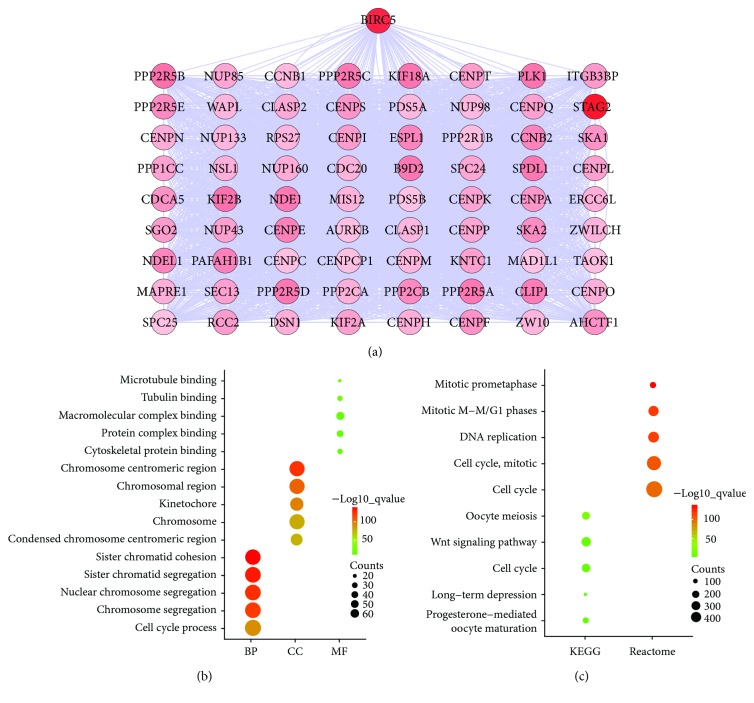
Figure 6.
Coexpression network construction and enrichment analysis. (a) Coexpression network: the higher degree is represented by a redder color. (b) GO analysis: top 5 of biological processes (BP), cellular components (CC), and molecular function (MF). (c) Pathway analysis: top 5 KEGG pathways and Reactome pathways.

