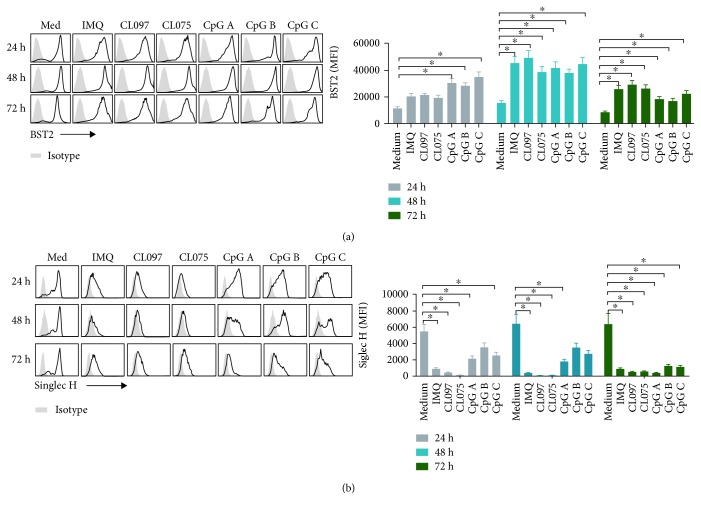
Figure 2.
The expression of markers on pDCs after activation with TLR7 and TLR9 ligands. We harvested pDCs after activation with TLR7 ligands (IMQ, CL097, and CL075) and TLR9 ligands (CpG A, CpG B, and CpG C) for 24, 48, and 72 hours. The concentration of each ligand was 1.5 μM. We then assessed the expression of markers BST2 (a) and Siglec-H (b) on pDCs by flow cytometry. Data shown are expressed as mean ± SEM (n = 6/group) and represent three independent experiments with similar results. Statistical significance of differences between groups was determined; ∗ p < 0.05.

