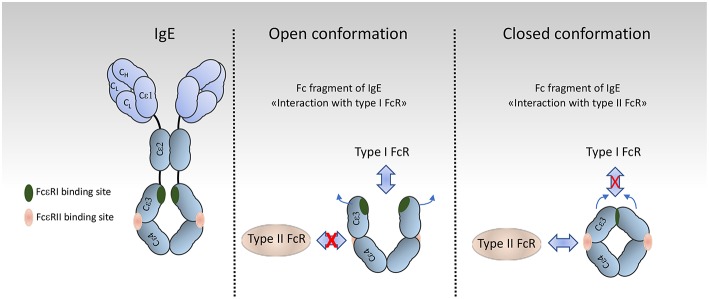
Figure 2.
Organization and conformational rearrangements of the IgE Fc. (left), IgE and the binding sites to FcεRI (green) and to CD23 (pink) [adapted from Pennington et al. (24)] (Middle and Right). Representation of the open and closed conformations, respectively, of the IgE Fc Cε3–4 domains, and the mutual allosteric inhibition by FcεRIα (green) and CD23 (pink).

