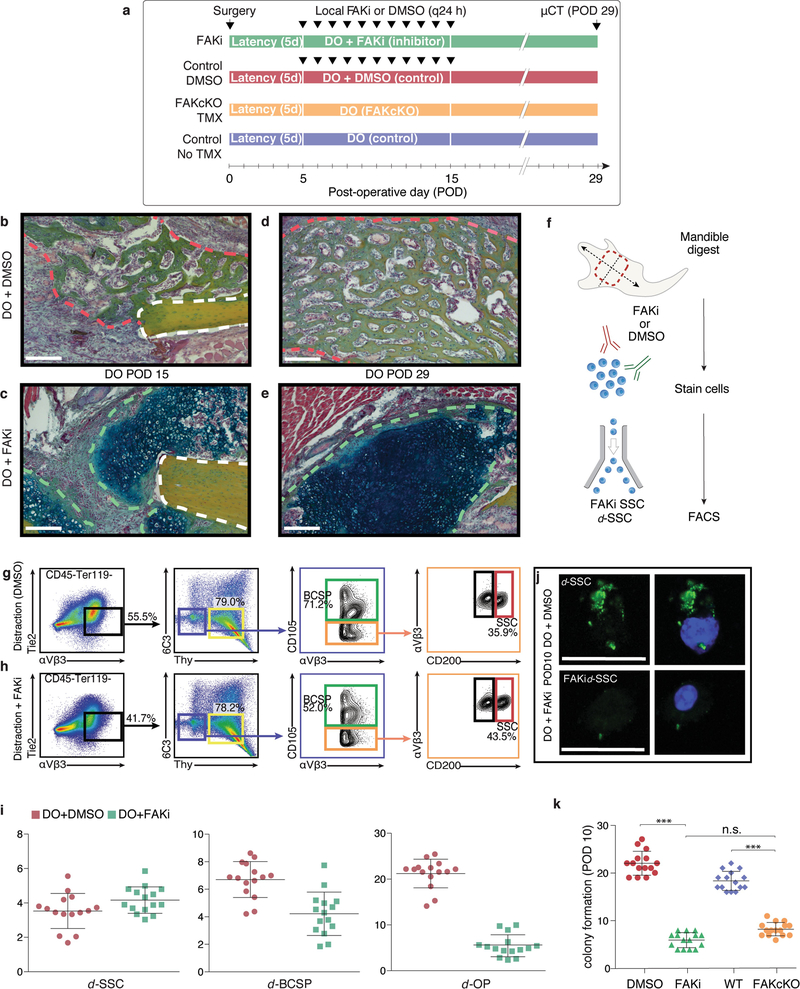
Extended Data Fig. 6 |. Expansion of SSCs and progenitor cells depends on FAK.
a, Timeline for FAK inhibition and conditional genetic knockout during distraction, with respective control conditions, for μCT analysis (Fig. 3a–d) at mid-consolidation (POD29). b, Pentachrome staining of transverse section from mandibles treated with DMSO during distraction osteogenesis and collected at POD15. The white dotted line indicates cortical bone at the osteotomy site; the red dotted line indicates bone that newly formed in response to distraction. Representative of three independent replicates. c, As for b, but for FAKi treatment. The green dotted line indicates cartilage that newly formed in response to FAKi during distraction osteogenesis. d, As for b, but for POD29. e, As for c, but for POD29. f, Schematic showing FACS isolation of SSCs and BCSPs from mandible calluses for subsequent in vitro analyses. g, h, FACS isolation of SSCs and BCSPs from distraction control mandibles receiving DMSO injections (g; 55.5%) versus FAK-inhibitor injections (FAKi) (h; 41.7%), revealing diminished expansion of the SCC hierarchy (first column, black gate) in response to FAK inhibition by POD10. The ratio of SSCs (red gate) to their committed bone progenitors (BCSPs, green gate) during distraction was substantially disrupted by FAK inhibition, such that the proportion of SSCs was higher. Representative of three independent replicates. i, Quantification of the frequency of d-SSCs, d-BCSPs and d-OPs within mandibular calluses collected at POD10 after FAKi or control injections (n = 6; error bars indicate s.d. from the mean). j, Representative fluorescence micrographs showing phosphorylated-FAK activity (left column, green) in d-SSCs after treatment with DMSO (top) or with FAK inhibitor (bottom). Right column, phospho-FAK fluorescence merged with DAPI fluorescence. Representative of three independent replicates. k, Quantification of d-SSC colony formation in vitro in response to FAKi and in a FAK(cKO), compared with their respective control conditions (n = 15 per condition; ***P < 0.001, Tukey’s multiple comparisons; means ± s.d.). Direct comparison of colony formation in FAKi and FAK(cKO) conditions was not significantly different. n refers to the number of animals in each independent experiment.

