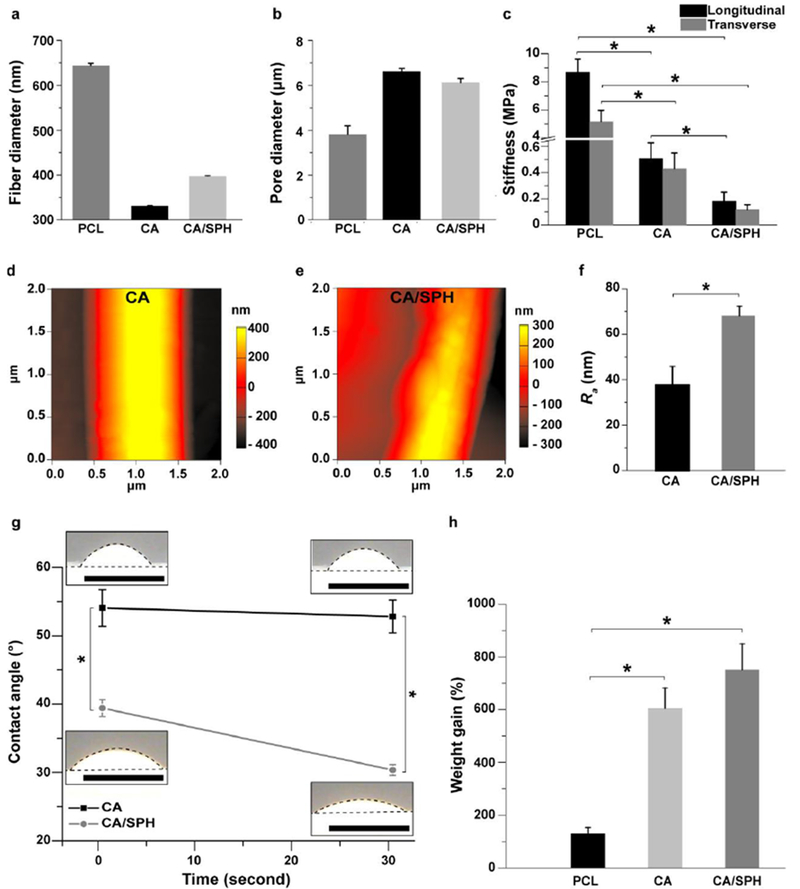
Figure 2.

Characterization of mechanical properties and surface chemistry. (a–b) Fiber diameter and pore diameter analysis for PCL (6 wt/v%), CA (10 wt/v%), and CA/SPH (10 wt/v% / 5 wt/v%) nanofiber scaffolds. Bars represent standard error, n=10 from 3 productions. (c) Stiffness measurement for PCL (6 wt/v%), CA (10 wt/v%), and CA/SPH (10 wt/v% / 5 wt/v%) nanofibers in the wet state on the longitudinal and transverse directions. Bars represent standard error, n=5 from 3 productions, * indicates p < 0.05. (d–f)AFM images of (d) CA (10 wt/v%) and (e) CA/SPH (10 wt/v% / 5 wt/v%) nanofibers with (f) roughness (Ra) of nanofibers (n=3, FOV=3 from 3 productions). (g) Bright field images of water droplets on CA (10 wt/v%) and CA/SPH (10 wt/v% / 5 wt/v%) cast films with contact angle analysis (n=3 from 3 productions). Dots delimit water droplet and film. Scales are 5 mm. (h) In vitro water absorption measurements by weight gain (n=6 from 3 productions). Bars represent standard error, * indicates p < 0.05.
