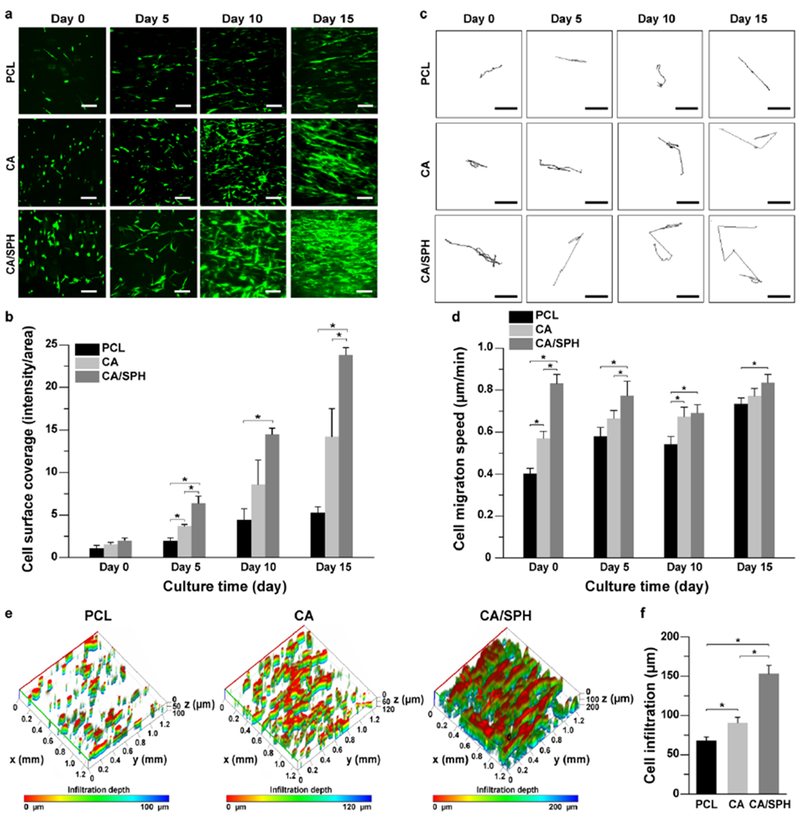
Figure 3.

In vitro fibroblast coverage, migration, and infiltration. (a–b) (a) Representative confocal microscopy images of GFP-expressing human neonatal dermal fibroblasts (HNDF) on nanofibers with (b) analysis of surface area covered by cells at day 0, 5, 10, and 15. Scales are 50 μm. Bars represent standard error, n=5, FOV=5 from 3 productions, * indicates p < 0.05. (c–d) (c) Representative binary images of tracking a single cell on nanofibers at day 0, 5, 10, and 15 for calculating (d) migration speed of HNDF. Scales are 50 μm. Bars represent standard error, n=5, FOV=5 from 3 productions, * indicates p < 0.05. (e-f) (e) Representative 3D-recontructed confocal microscopy images of HNDF on nanofibers after 15 days of cell culture with (f) quantitative analysis of cell infiltration depth. Bars represent standard error, n=5 for PCL and n=8 for CA and CA/SPH, FOV=3 from 3 productions, * indicates p < 0.05.
