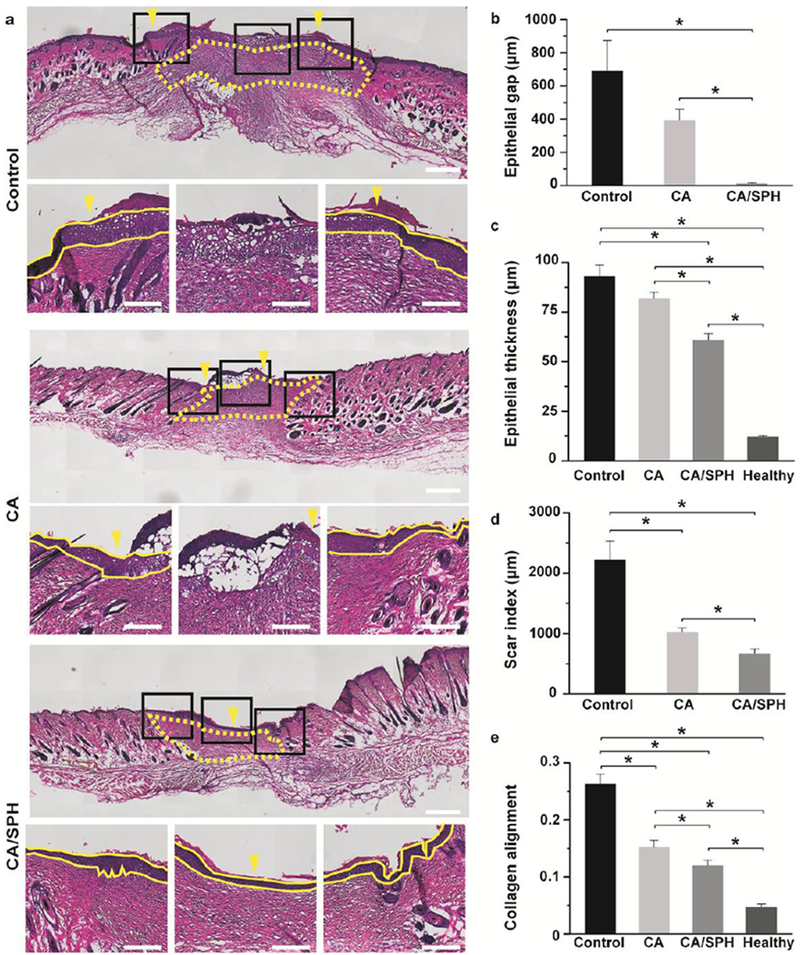
Figure 6.

Histology analysis. (a) H&E staining of wounds after 14 day post-surgery (untreated control, treated with CA nanofibers, and treated with CA/SPH nanofibers). In the top panel, the yellow arrows indicate the edge of the epidermal layer and the yellow dots outline the scar area. The yellow lines in the bottom panels of the zoom-in images delimit the epidermal layer in the skin tissue. Scales in the top and bottom panels are 500 μm and 200 μm, respectively. (b–e) Quantitative analysis of b) epithelial gap, c) epithelial thickness, d) scar index, and e) collagen alignment from H&E staining images. Fiber wound dressings were prepared from 3 productions for each condition Bars represent standard error, n=3 wounds and 3 mice for control, n=4 wounds and 3 mice for CA and CA/SPH nanofibers, n=5 wounds and 5 mice for healthy tissue, at least 3 sections per wound, * indicates p < 0.05.
