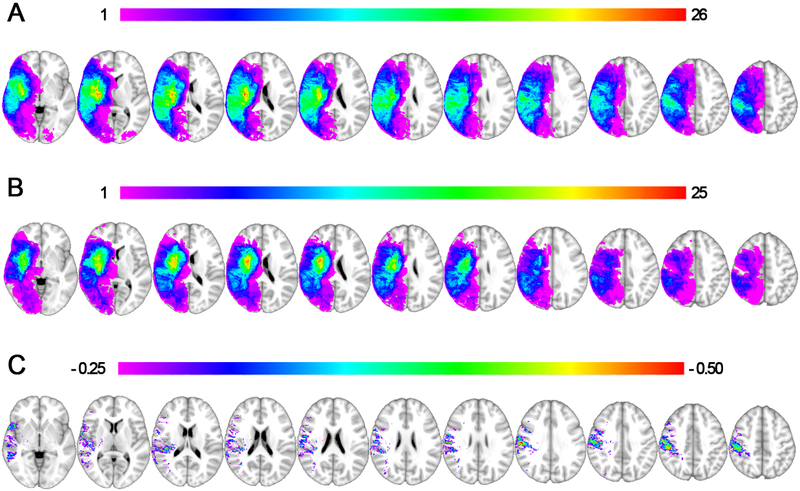
Figure 1. Lesion Overlap and Subtraction Maps.
1A shows a lesion overlap of all subjects with lateropulsion (n = 50, peak overlap of 26/50 at MNI coordinate 31, −13, 11) and 1B shows all subjects in the comparison group without lateropulsion (n = 50, peak overlap of 25/50 at MNI coordinate 30, −14, 5). 1C displays a proportional subtraction, or difference map, between the lateropulsion and comparison group, which demonstrates proportionally higher levels of overlap in patients with lateropulsion at the inferior parietal lobe (peak 55%, MNI coordinate 56, −17, 32). For each image a color palate is displayed with red representing the peak overlap.

